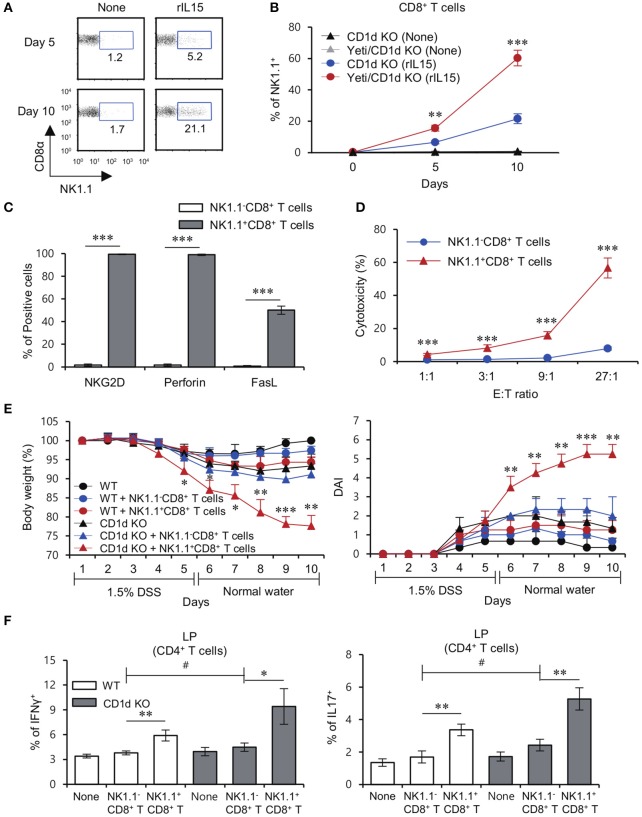
Figure 5.
CD1d-restricted iNKT cells exhibit inhibitory effects on the pathogenesis of NK1.1+CD8+ T cell-mediated colitis. (A) Purified NK1.1+ cell-depleted CD8+ T cells from the MLN of CD1d KO mice were cultured with rIL15 for 5 or 10 days. The percentage of the NK1.1+ population among all CD8+ T cells was evaluated by flow cytometry at the indicated time points. (B) Purified NK1.1−CD8+ T cells from the MLN of CD1d KO and Yeti/CD1d KO mice were cultured with rIL15 for 5 or 10 days. The percentage of the NK1.1+ population among total CD8+ T cells was evaluated by flow cytometry at the indicated time points. (C) The expression of NKG2D, perforin, and FasL among unstimulated NK1.1−CD8+ T cells or IL15-stimulated NK1.1+CD8+ T cells were assessed by flow cytometry on day 10 after cytokine stimulation. (D) Cytotoxicity of either unstimulated NK1.1−CD8+ T cells or IL15-stimulated NK1.1+CD8+ T cells from the CD1d KO MLN was evaluated using 7-AAD/CFSE assay. (E,F) Either NK1.1−CD8+ T cells (1 × 10⁶) or IL15-stimulated NK1.1+CD8+ T cells (1 × 10⁶) from the CD1d KO MLN were i.v. transferred to CD1d KO mice. (E) Daily body weight changes and DAI score of each group were evaluated 10 days after 1.5% DSS treatment. (F) Intracellular IFNγ and IL17 production in LP CD4+ T cells from these mice were determined by flow cytometry on day 10. The mean values ± SD (n = 3 in D; n = 4 in A–C; n = 5 in E and F; per group in the experiment; Student's t-test; *P < 0.05, **P < 0.01, ***P < 0.001) are shown. Two-way ANOVA (genotype × treatment) showed an interaction between these two factors (#P < 0.05).

