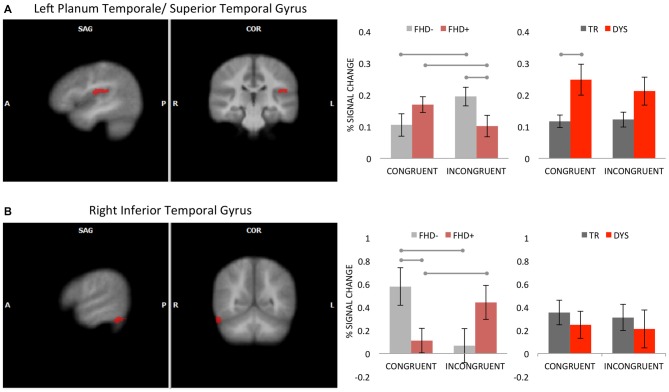
Figure 3.
Interaction effect between group and multisensory conditions (congruent, incongruent) in the left planum temporale/superior temporal gyrus (PT/STG) (A) and in the right inferior temporal gyrus (B). The clusters are displayed on average brain from all participants at voxel-wise threshold of p < 0.01, corrected for multiple comparisons using cluster extent threshold of p < 0.05. Bar graphs illustrate the percent signal change with SEM for multisensory conditions in FHD− and FHD+ (horizontal lines illustrate significant post hoc tests) as well as in DYS and typical reading (TR) children (horizontal line illustrates significant bootstrap statistics).

