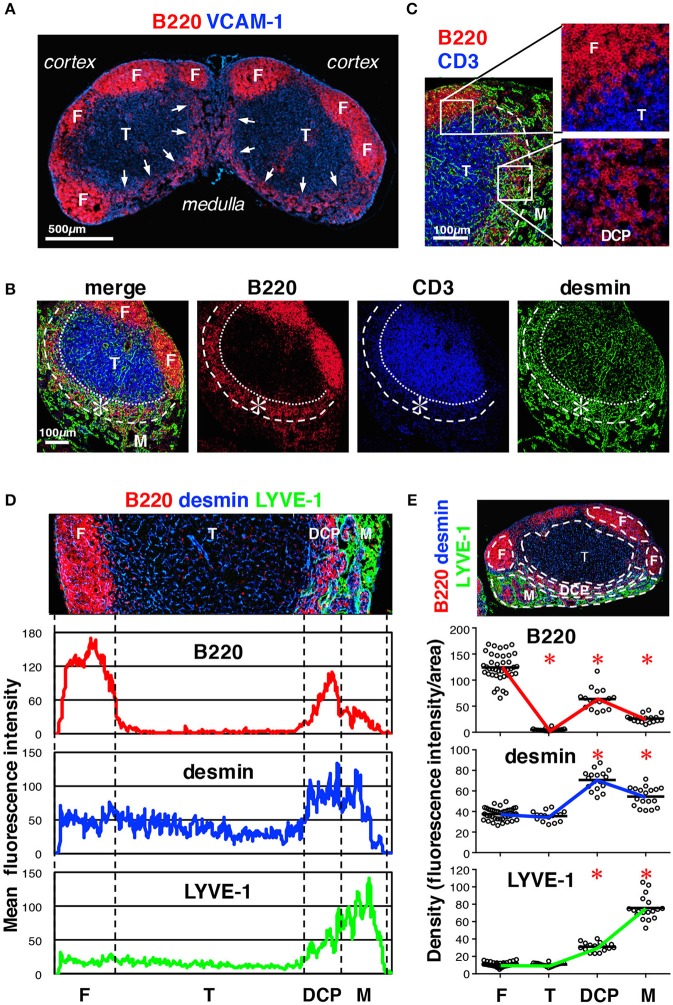
Figure 3.
Characterization of the DCP of mouse LNs. (A) Substantial B cell accumulation in the periphery of the deep cortex adjoining the medulla (inguinal LN, arrows). (B) The DCP is a belt-like zone surrounding the bottom of the T cell area (asterisks). (C) B and T cells were intermingled in the DCP (higher magnification view in the lower right), as compared to the superficial cortex, in which they were clearly segregated (upper right). Laminin signals are eliminated in the right micrographs. (D) Enrichment of desmin correlated with B cell accumulation in the DCP. Average fluorescent intensity profiles of B220, desmin, and LYVE-1 along the cortex–medulla axis. Desmin signals were also high in the medulla. (E) Quantitative analysis of signal densities in LN subcompartments. The micrograph is representative of the region of interest (ROI) from the image data. Marker densities in each region are plotted (open circles) in the lower graphs (bars, mean; asterisks, significantly different compared to the follicles, p < 0.0001).

