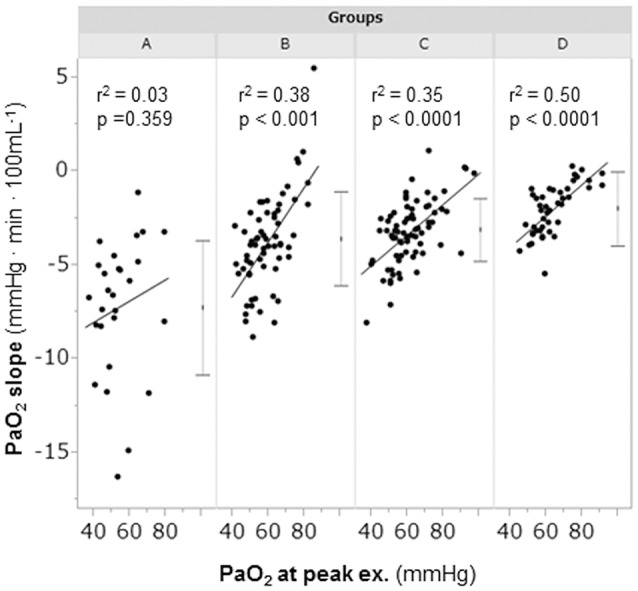
Figure 4.

The relationships between the PaO2-slope and the PaO2 at peak exercise during cardiopulmonary exercise testing. Group A (< 11 mL·min−1·kg−1); group B (11 to < 15 mL·min−1·kg−1); group C (15 to < 21 mL·min−1·kg−1); and group D (≥21 mL·min−1·kg−1). The horizontal lines represent the standard deviation. The dots between the horizontal lines represent the mean. PaO2, arterial oxygen tension.
