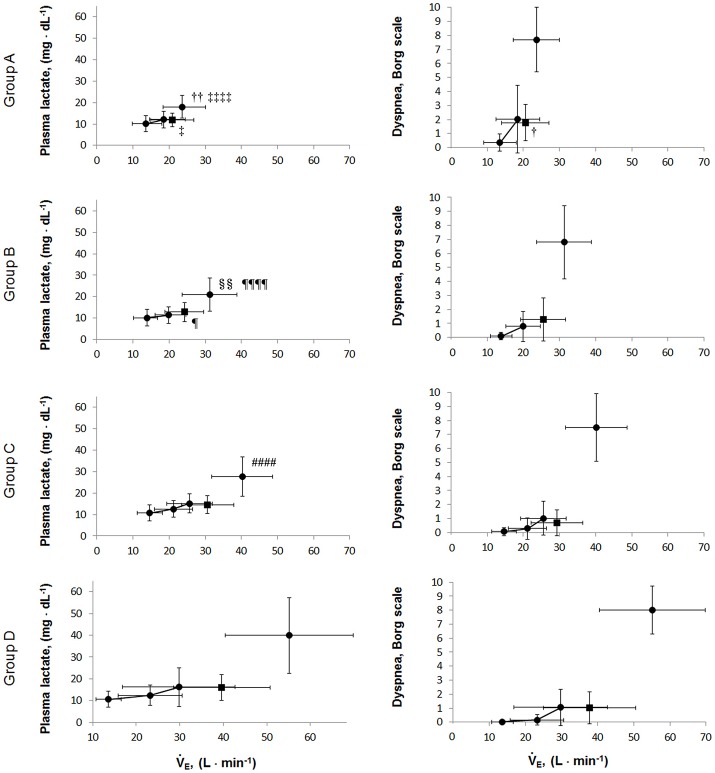
Figure 6.
The relationships of the plasma lactate levels and dyspnea borg scales during exercise. Values are presented as mean (SD) and were analyzed using the Tukey-Kramer honestly significant difference test. Circular symbols show exertional variables at rest, during exercise, and at peak exercise. Square symbols show plasma lactate and dyspnea borg scale break points. Plasma lactate borg scale break points were determined in 15/28 in group A, 43/64 in group B, 55/77 in group C, and 42/46 group D. Dyspnea borg scale break points were determined in 14/28 in group A, 46/64 in group B, 62/77 in group C, and 40/46 group D. A vs. B; †p < 0.05, ††p < 0.01, A vs. D: ‡p < 0.05, ‡‡‡‡p < 0.0001; B vs. C: §§p < 0.01, B vs. D: ¶p < 0.05, ¶¶¶¶p < 0.0001; C vs. D: ####p < 0.0001.

