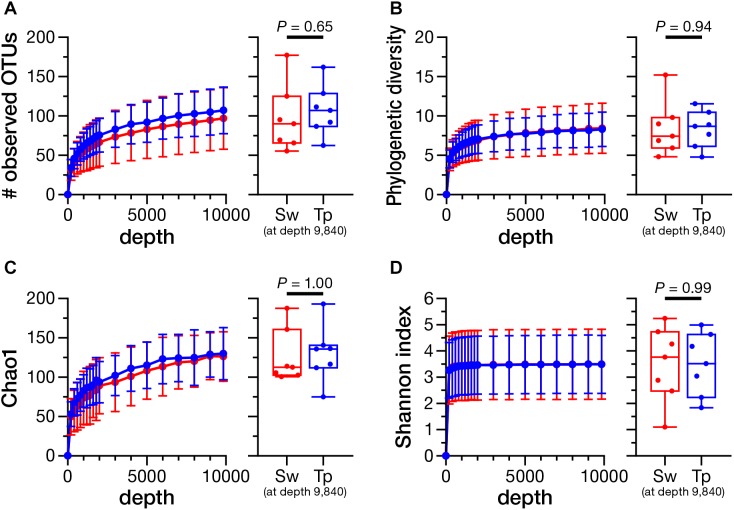
FIGURE 4.
Rarefaction curves and the comparison of alpha diversity indices between the swabbing and tape-stripping methods. A rarefaction analysis on the number of observed operational taxonomic units (OTUs) (A), phylogenetic diversity (B), Chao1 index (C), and Shannon diversity index (D). The analysis was performed up to 9,840 depth. The colors of each plot were assigned as red for the swabbing method and blue for the tape-stripping method. Each index was compared at the rarefaction depth at 9,840. Sw, swabbing method; Tp, tape-stripping method.

