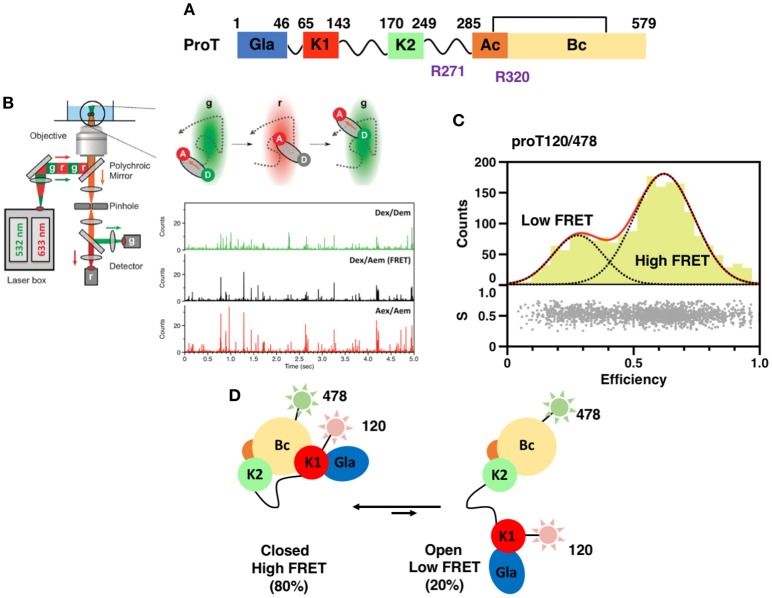
Figure 1.
(A) Color-coded domain architecture of prothrombin displaying the location of proteolytic sites R271 and R320 that are cleaved by the prothrombinase complex. (B) Scheme of a confocal microscope equipped for sm-PIE-FRET experiments. Briefly, the donor and acceptor dyes are excited with a ps pulsed diode laser at 532 and 633 nm, respectively. To achieve PIE, the 532 nm laser is electronically delayed (25–50 ns) relative to the 633 nm laser. Signals from single molecules are observed as bursts of fluorescence and detected with two SPAD detectors. Data are stored in the Time-tagged Time-resolved Mode (15, 16). (C) smFRET histogram for the prothrombin mutant S120C/S478C (proT120/478) in which fluorescent dyes were attached at position 120 in kringle 1 and 478 in the B-chain (16). The bottom section of the graph depicts the stoichiometry, S, vs. FRET efficiency for each diffusing molecule. The upper section shows the one-dimensional efficiency histogram of the molecules in the bottom section. ProT120/478 shows two distributions of molecules with distinct FRET efficiencies (low and high), supportive of the existence of closed and open conformations in solution. (D) Schematic models of closed and open conformations built from smFRET measurements.

