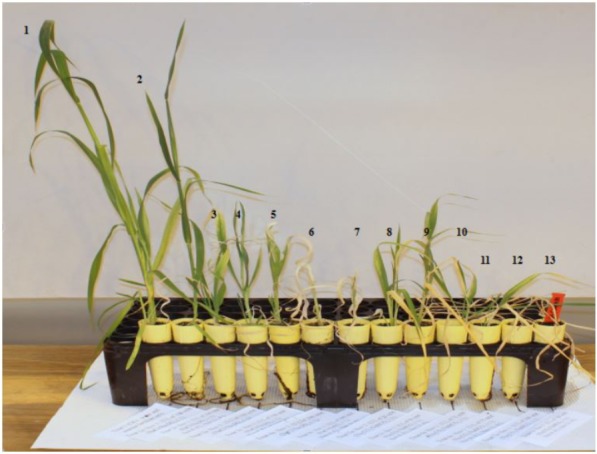
FIGURE 7.

Plant height of a single genotype under varied salt and alkali stresses. 2–7, salt stress; 8–13, alkali stress. 1, Control; 2 and 3, oat under l00 mmol L-1 salt stress; 4 and 5, oat under 150 mmol L-1 salt stress; 6 and 7, oat under 200 mmol L-1 salt stress; 8 and 9, oat under 50 mmol L-1 alkali stress; 10 and 11, oat under 75 mmol L-1 alkali stress; 12 and 13, oat under l00 mmol L-1 alkali stress.
