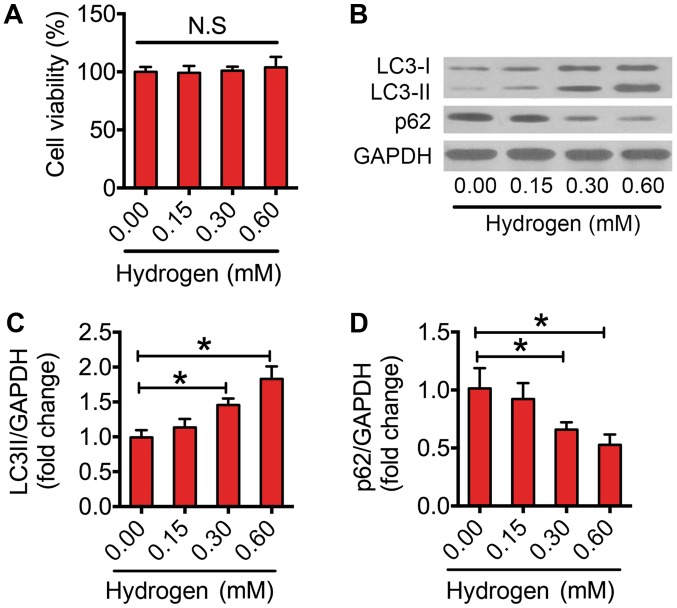
Figure 3.
Activation of autophagic flux following exposure to hydrogen in RAW264.7 cells. (A) Cell Counting kit-8 assay of RAW264.7 cells treated with various concentrations (0.00, 0.15, 0.30 and 0.60 mM) of hydrogen for 24 h. (B) Western blots performed after RAW264.7 cells were treated with various concentrations (0.00, 0.15, 0.30 and 0.60 mM) of hydrogen for 24 h. The density of the western blot bands for (C) LC3-II and (D) p62 indicated in (B) was quantified using ImageJ software. The data are presented as the mean ± standard error of the mean from three independent experiments. *P<0.05 as indicated. N.S, not significant; LC3, microtubule-associated protein 1A/1B-light chain 3.

