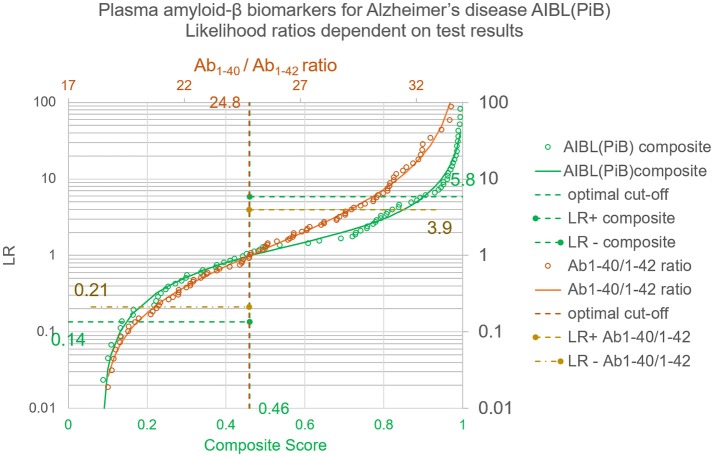
Figure 3.
Likelihood ratios for test results of the plasma amyloid-β study. Whereas the LR+ and LR− provide an average over all positive or negative results, the LRs dependent on quantitative test results and calculated with the Bézier curve parameters of Table 1 give a value for each individual test result. The circles correspond to the LRs of the empirical ROC points, the lines show the generalized relation between test results and LRs as calculated with λ = 1/(1+LR) and the coefficients shown in Table 2.

