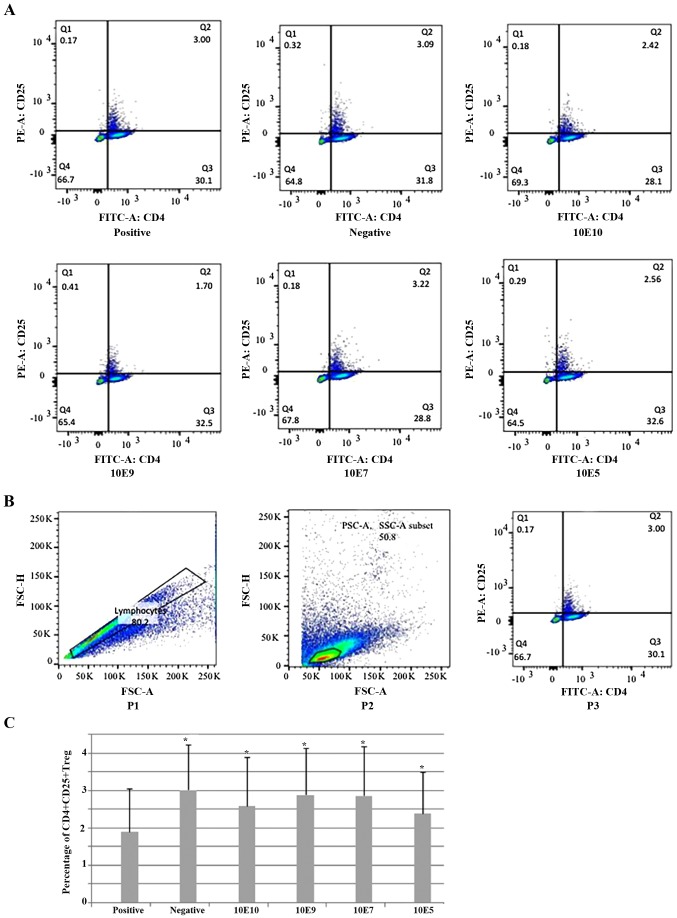
Figure 5.
Percentage of CD4+CD25+ Tregs in the spleen. (A) Representative flow cytometry figures of CD4 and CD25 staining of splenocytes from 1 mouse in each treatment group and control group. Cells were stained with fluorescent-labeled anti-CD4 and -CD25 antibodies and analyzed in a flow cytometer. (B) Gating strategy for flow cytometry analysis. In this sample gating, cells were first gated for singlets (P1: FSC-H vs. FSC-A) and lymphocytes (P2: SSC-A vs. FSC-A). The lymphocyte gate was further analyzed for identifying CD25 and CD4, which were stained with FITC and PE, respectively (P3: PE-CD25 vs. FITC-CD4). (C) Percentage of splenic CD4+CD25+Tregs among six groups. *P<0.05 vs. positive. CD, cluster of differentiation; Treg, regulatory T cell; FSC-H, forward scatter height; FSC-A, forward scatter area; SSC-A, side scatter area; Q2, CD4+CD25+Tregs; FITC, fluorescein isothiocyanate; PE, phycoerythrin.

