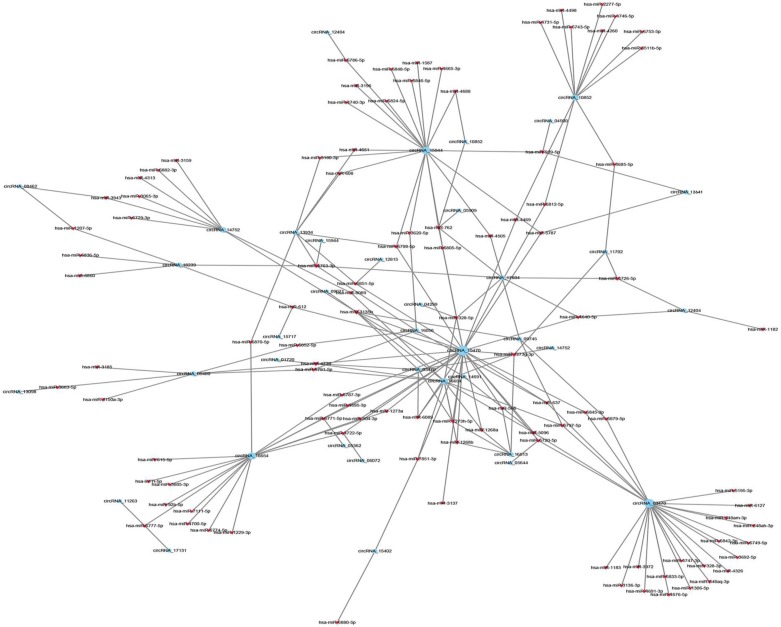
Figure 4.
The panorama network of top 300 significantly correlated circRNAs (red nodes) and their target miRNAs (blue nodes). Circle nodes represent circRNAs and triangle nodes represent miRNAs. The size of circle and triangle indicates p-value with larger size stand for smaller p-value. The network was generated based on Pearson correlation coefficient analysis (the absolute value of PCC ≥ 0.90, p-value < 0.05 and FDR < 0.01).

