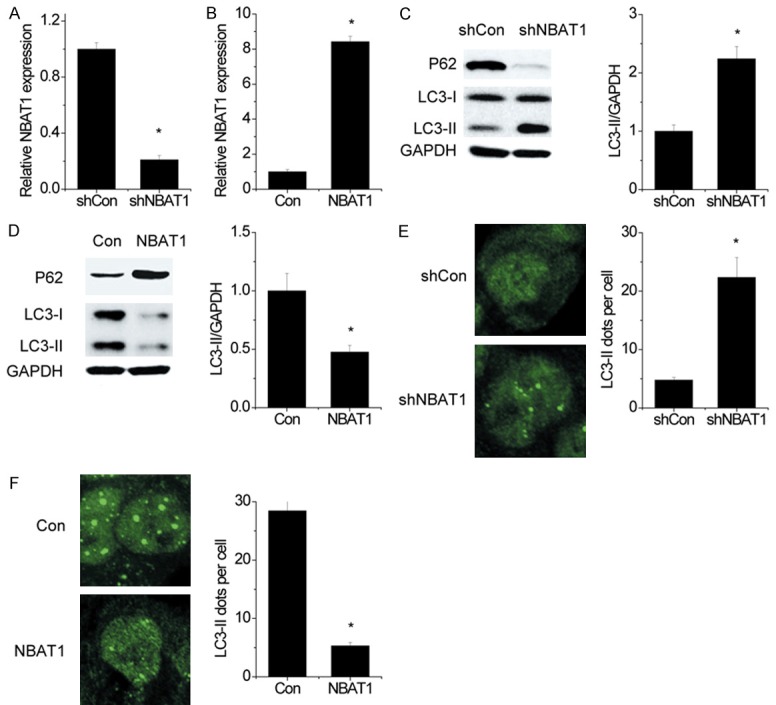
Figure 1.

NBAT1 inhibits autophagy in NSCLC cells. (A) The NBAT1 expression was silenced in A549 cells, and the NBAT1 levels were detected by qRT-PCR. (B) The NBAT1 was overexpressed in 95D cells, and the NBAT1 levels were examined by qRT-PCR. (C and D) LC3, P62 and GAPDH were analyzed by western blot. Representative western blot and densitometric analysis normalized to GAPDH demonstrating the effect of NBAT1 silencing (C) and NBAT1 overexpression (D) on LC3-II levels. (E and F) Representative immunofluorescent images showing redistribution of autophagic marker LC3 in NBAT1 knockdown (E) and NBAT1 overexpressing (F) cells were taken on a confocal microscope. The average number of LC3 dots per cell was counted in more than 5 fields with at least 100 cells for each group. *P < 0.05.
