Figure 4.

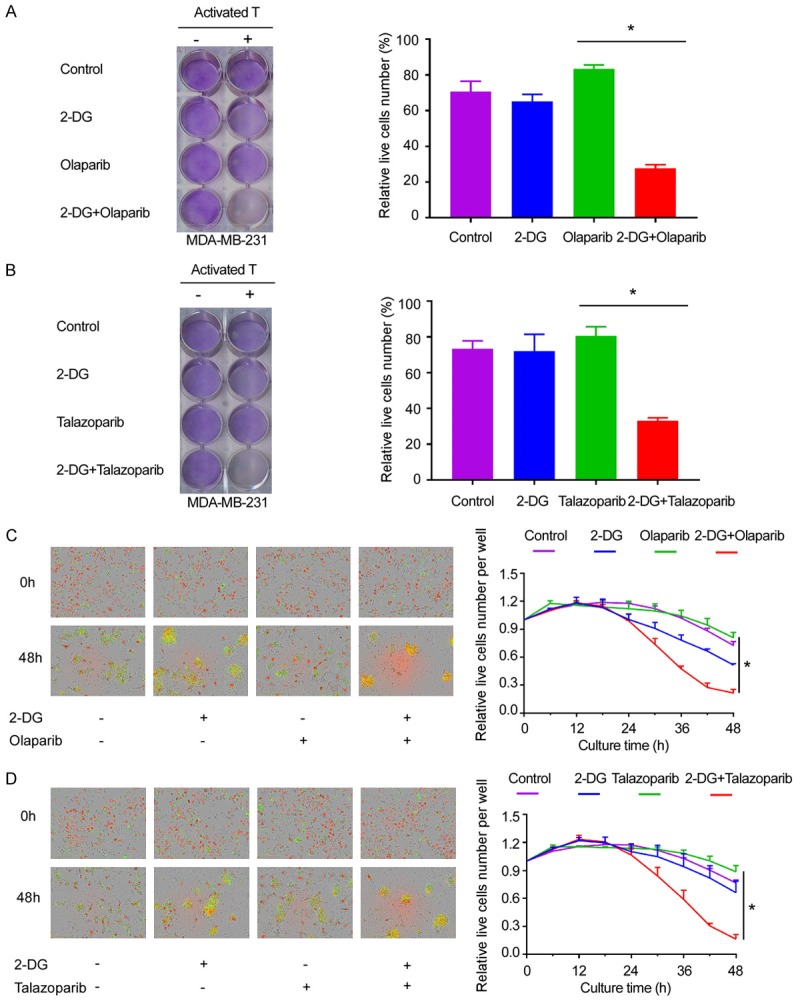
2-DG enhances T-cell killing efficiency. A. PBMCs were co-cultured with MDA-MB-231 cells at a 15:1 ratio for 48 hours and treated with 2 mmol/L 2-DG and/or 10 µmol/L olaparib. Left, the cells were stained with crystal violet. Right, the percentages of live MDA-MB-231 cells co-cultured with activated PBMCs (normalized to MDA-MB-231 cells cultured without PBMCs) at 48 hours. *P<0.05. B. MDA-MB-231 cells were cultured as those shown as in panel and cells were then treated with 2 mmol/L 2-DG and/or 10 nmol/L talazoparib. Left, the cells were stained with crystal violet. Right, the percentage of live MDA-MB-231 cells co-cultured with activated PBMCs (normalized to those cultured without PBMCs) at 48 hours. *P<0.05. C. MDA-MB-231 cells expressing nuclear red fluorescent protein (RFP) seeded in the 96-well plate were first treated as those shown in panel a. Left, representative merged images showing red fluorescent (nuclear-restricted RFP) and green fluorescent (caspase-3/7 substrate) objects. Images were captured using an IncuCyte Zoom microscope. Right, The number of live cells (red fluorescent objects) at 6 hours interval were counted and normalized to that at the zero time point. *P<0.05. D. MDA-MB-231 cells expressing nuclear RFP were first treated as those shown in panel b were. Left, Representative merged images showing red fluorescent (nuclear-restricted RFP) and green fluorescent (caspase-3/7 substrate) objects. Images were captured using an IncuCyte ZOOM microscope. Right, the number of live cells (red fluorescent objects) were counted at 6 hours interval were counted and normalized to that at the zero time point. *P<0.05.
