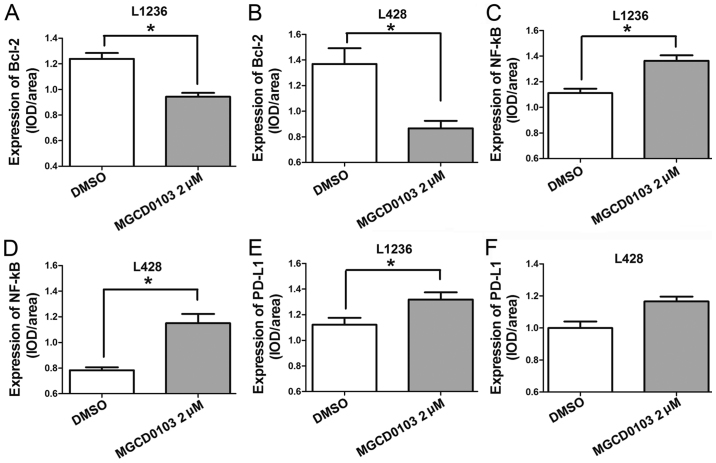
Figure 3.
Representative confocal microscopic data for IOD/area detection. (A and B) The IOD/area ratio for Bcl-2 was lower in the MGCD0103 group than in control cells, in both cell lines. IOD/area ratios for (C and D) NF-κB and (E and F) PD-L1 were higher in the MGCD0103 group than in controls, in both cell lines. Data are presented as the mean + the standard error of the mean. *P<0.05. IOD, integrated optical density; Bcl-2, B cell lymphoma-2; NF, nuclear factor; PD-L1, programmed death-ligand 1; DMSO, dimethyl sulfoxide.

