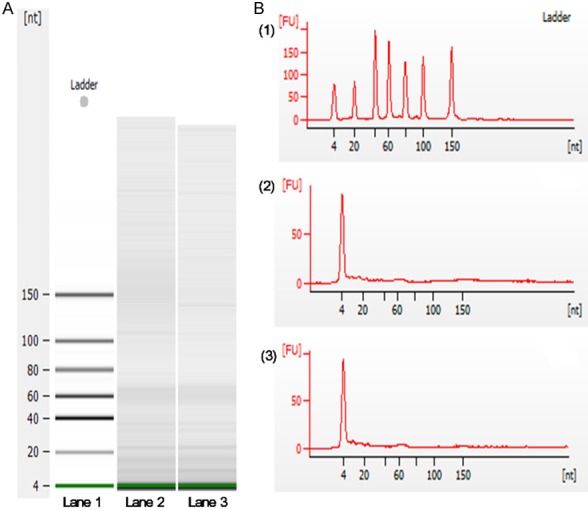
Figure 2.

Plasma derived exosomal RNA analysis. A. Digital gel electropherograms of RNA from plasma exosome. Lane 1, RNA ladder shows the sizes of the nucleotides. Lane 2 and lane 3 display the size of the exosomal RNA from OLP patient and normal individual respectively. Results demonstrated that small RNAs were dominant in the exosomal RNAs. B. (1) Profile of RNA standard; (2) Total RNA from an OLP patient; (3) Total RNA from a normal individual. The data showed that the samples from OLP patients and normal individuals were enriched in nucleotide < 25 nt, indicating the presence of miRNAs.
