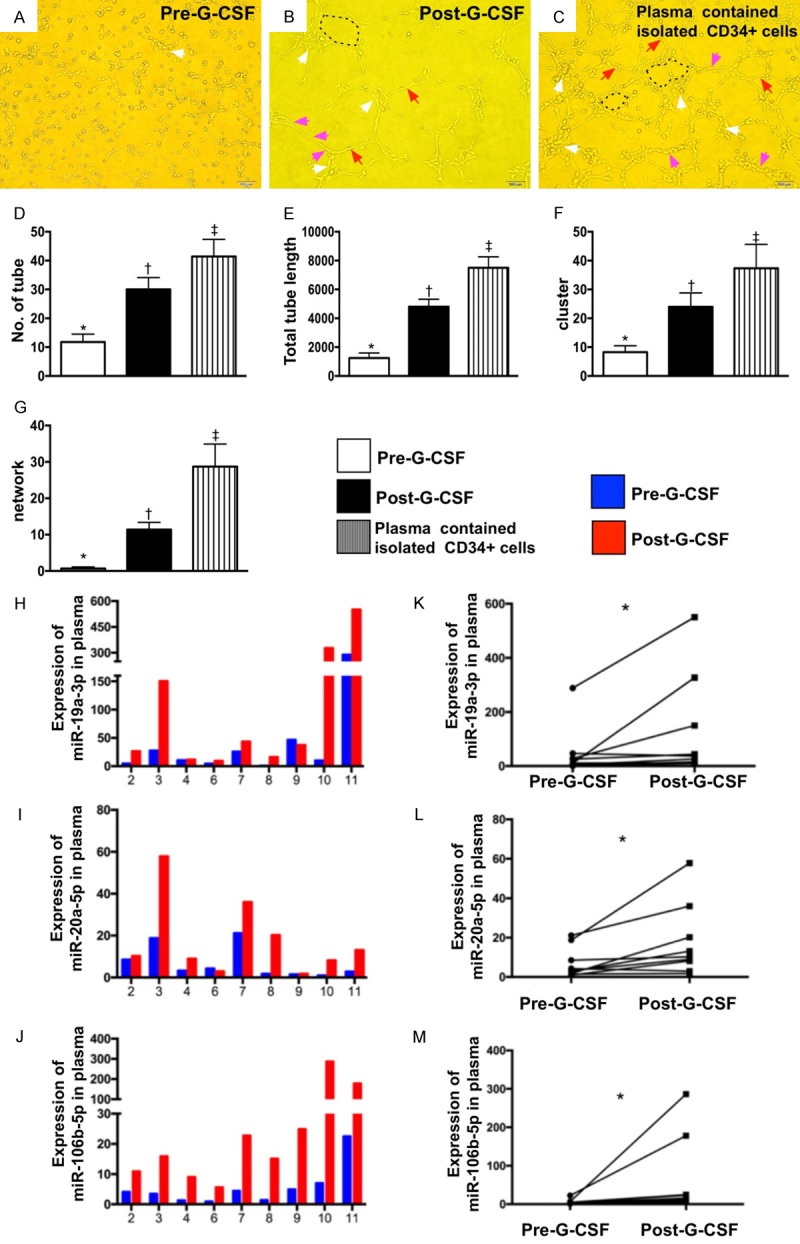
Figure 2.

Matrigel assay for assessment of EPC angiogenesis ability and comparison of circulating microRNA expressions in plasma between prior to and after G-CSF treatment. (A-C) Microscopic findings (100×) Matrigel assay showing the angiogenesis results of tubular length (pink arrows) and number of tubular (red arrows), cluster (white arrows) and network (black dotted line) formation among three groups, i.e., (A) pre-G-CSF treatment, (B) post-G-CSF treatment and (C) plasma concentration containing the isolated CD34+ cells. (D) Analytical result of number of tubular formation, *vs. other groups with different symbols (†, ‡), P<0.0005. (E) Analytical result of total tubular length, *vs. other groups with different symbols (†, ‡), P<0.0001. (F) Analytical result of number of cluster formation, *vs. other groups with different symbols (†, ‡), P<0.005. (G) Analytical result of network formation, *vs. other groups with different symbols (†, ‡), p<0.0001. (H-J) Illustrating the expressions of circulating levels of five miRNAs: miR-19a-3p, miR-106b-5p, miR-26b-5p in individual patient prior to and after receiving G-CSF treatment. (K) Analytical result of miR-19a-3p level, *indicated pre- vs. post-G-CSF, P<0.001. (L) Analytical result of miR-20a-5p level, *indicated pre- vs. post-G-CSF, P<0.001. (M) Analytical result of miR-106b-5p level, *indicated pre- vs. post-G-CSF, P<0.001. All statistical analyses were performed by Friedman ANOVA, followed by post hoc analysis with Wilcoxon signed rank test (n=9 for each group). Symbols (*, †, ‡) indicate significance (at 0.05 level). HPF = high-power field; G-CSF = granulocyte-colony stimulating factor; EPC = endothelial progenitor cell.
