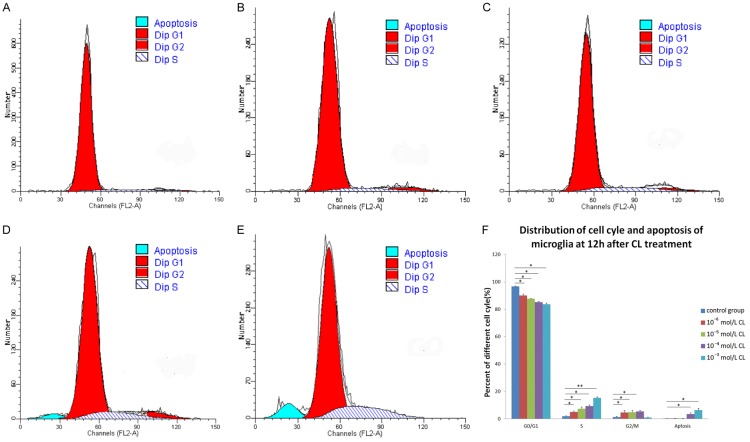
Figure 2.
Microglial cell cycle phase and apoptosis 12 h after stimulation with coriaria lactone (CL) as detected by flow cytometry. (A) control group; (B) 10-6 mol/L CL group; (C) 10-5 mol/L CL group; (D) 10-4 mol/L CL group; (E) 10-3 mol/L CL group; (F) Distribution of microglial cell cycle phase and apoptosis in each group 12 h after stimulation with CL. Compared with the control group, the percentage of microglia in G0/G1 phase was significantly lower (P < 0.05), but the percentage of microglia in S phase was significantly higher (P < 0.05) in each concentration stimulation group. The percentage of microglia in G2/M phases was significantly higher (P < 0.05) in each concentration stimulation group except for the 10-3 mol/L CL group. The percentages of apoptotic cells in 10-4 mol/L and 10-3 mol/L CL groups were higher compared with that of the control group (P < 0.05).

