Figure 1.

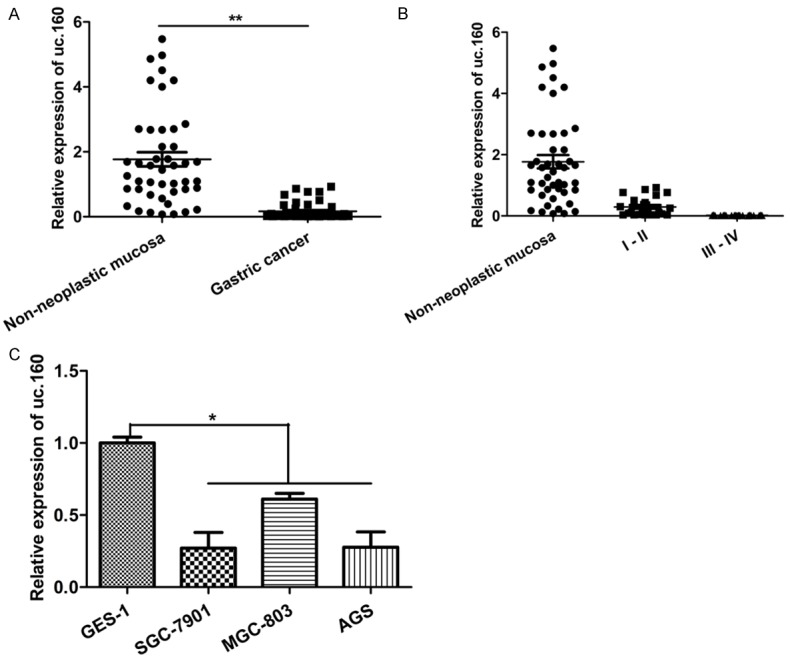
uc.160 expression was down-regulated in GC tissues and GC cell lines. A. Quantitative analysis of uc.160 level in 45 paired human GC tissues compared with their adjacent normal tissues. **P < 0.01 (t-test). The loading control was β-actin. B. Quantitative analysis of uc.160 level in GC tissues at different cliniclpathologcal stages (stage I and II, n = 24; stage III and IV, n = 21), and the relative expression level of uc.160 was similar. Pathological classification was done according to the AJCC Cancer’s TNM Classification system (7th Edition). C. Quantitative analysis of uc.160 level in three GC cell lines (SGC-7901, MGC-803, and AGS) and the immortalized gastric epithelial cell line (GES-1). The Y-axis shows relative expression of uc.160 and the uc.160 level from GES-1 was assigned as a relative value of 1. *P < 0.05 (t-test). The loading control was β-actin.
