
. 2018 Jul 24;7(9):957–964. doi: 10.1530/EC-18-0207
 This work is licensed under a
 Figure 3.
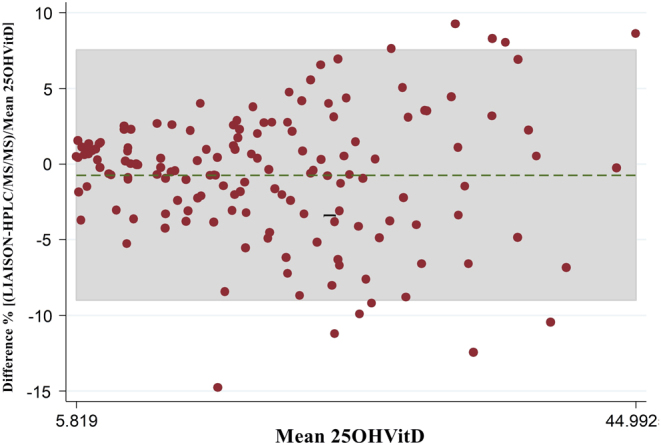
Bland–Altman plots shows percentage difference between 25OHD quantification with LIAISON and HPLC-MS-MS. Green line represents bias of −0.739% (means of paired difference) with 95% of limits of agreement (−9.00 to +7.52%).