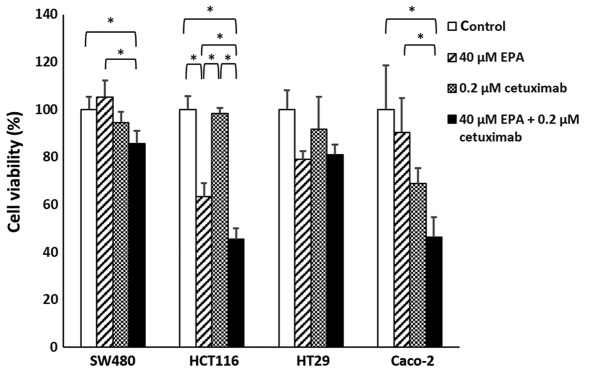
Figure 3.
Comparison of the cell viability among the different group of cells. White bars represent original cell treated with 1X PBS. Oblique line bars represent cells treated with 40 µM EPA. Meshed bar represent cells treated with 0.2 µM cetuximab. Black bars represent cells treated with 40 µM EPA 0.2 µM cetuximab. Error bar represent standards error, the 95% confidence interval. *P<0.05. EPA, eicosapentaenoic acid.

