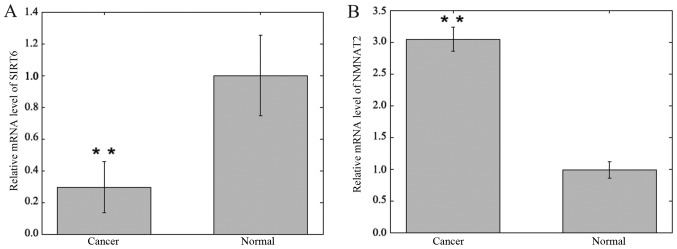
Figure 4.
Bar graph of the relative SIRT6 and NMNAT2 mRNA expression in colorectal cancer and adjacent tissue of 29 patients, as analyzed by reverse transcription-quantitative polymerase chain reaction. (A) Relative expression of SIRT6. (B) Relative expression of NMNAT2. All data represent the mean ± standard deviation of three independent experiments. **P<0.01. SIRT6, sirtuin 6; NMNAT2, nicotinamide mononucleotide adenylyltransferase 2.

