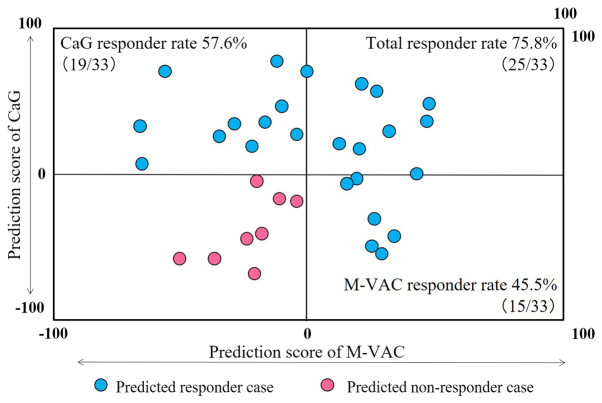
Figure 2.
Scatter plot of two PSs for each 33 patients. The horizontal rows represent M-VAC PS and the vertical columns represent CaG PS. Each case is plotted corresponded to M-VAC and CaG PSs. At least either M-VAC or CaG PS would be greater than zero; the cases plotted with blue represent positive PS cases, the cases plotted with red represent negative PS cases. M-VAC, methotrexate, vinblastine, doxorubicin plus cisplatin; CaG, carboplatin plus gemcitabine; PS, prediction score.

