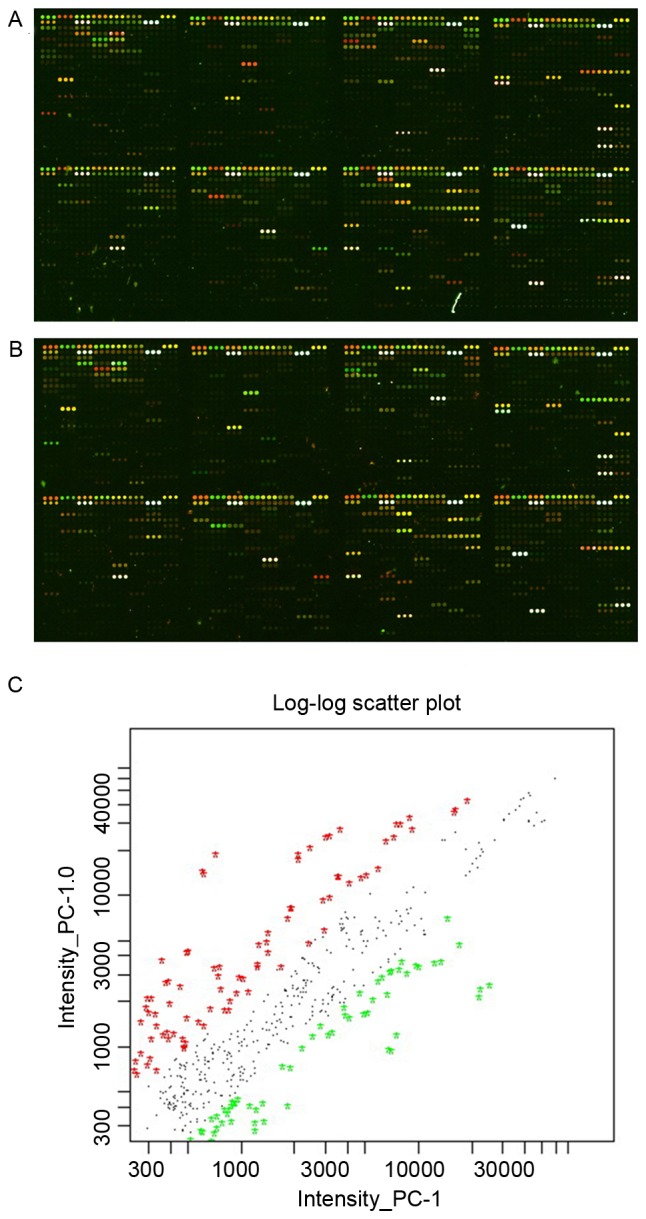
Figure 1.

miRNA chip overlay images. (A) Original image of two-channel miRNA microarray; PC-1.0 was labeled with red fluorescent Cy5 dye and PC-1 was labeled with green fluorescent Cy3 dye. (B) Original image of two-channel miRNA microarray; PC-1.0 was labeled with green fluorescent Cy5 dye and PC-1 was labeled with red fluorescent Cy3 dye. (C) Scatter plot of PC-1.0 and PC-1 data. miRNA, microRNA.
