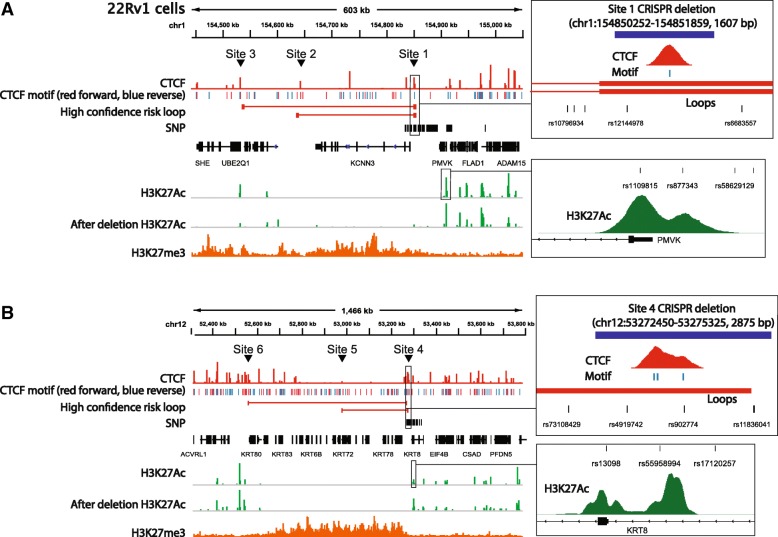
Fig. 10.
PCa risk-associated CTCF loops encompass enhancer deserts. Shown are genome browser snapshots of CTCF, CTCF motifs with orientation, H3K27Ac, and H3K27me3 ChIP-seq data for the regions near chromatin loops associated with the rs12144978 (a) or rs4919742 (b) risk SNPs. In each panel, the H3K27Ac ChIP-seq track for cells deleted for the region encompassing the PCa risk-associated SNP is also shown. Also shown are all fine-mapped SNPs in each locus and the high confidence risk loops identified by Hi-C chromatin interaction data anchored by each SNP and the RefSeq gene track. Insets show blowups of the regions containing the PCa risk-associated CTCF sites and PCa risk-associated H3K27Ac sites at each locus

