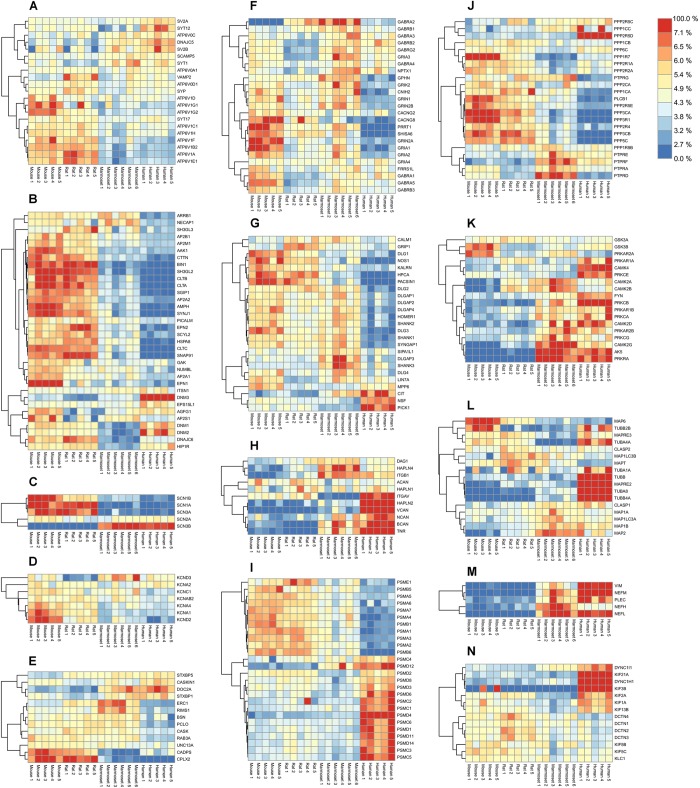
FIGURE 3.
Quantified proteins in various functional groups of interest. Abundance values were scaled by their total over all samples to reveal their relative enrichment, if any, between species. The color legend on the top-right shows the protein color gradient from relatively low abundances in blue to relative enrichment in red. (A) Synaptic Vesicle. (B) Endocytosis. (C) Sodium channels. (D) Potassium channels. (E) Presynaptic scaffold. (F) Ligand-gated ion channels and associated proteins. (G) Postsynaptic density. (H) Extracellular matrix. (I) Proteasome. (J) Phosphatases. (K) Kinases. (L) Microtubules. (M) Neurofilaments. (N) Motor proteins. Respective protein-protein Pearson correlation matrices are shown in Supplementary Figure S6.

