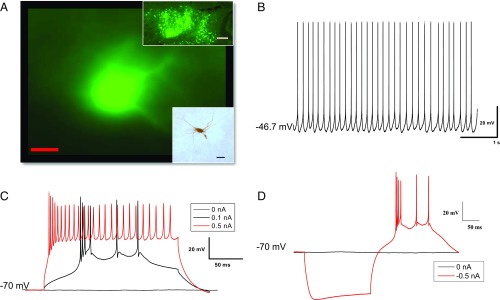
Fig. 3.
Typical recording traces from a representative rat DCN cell. (A) A representative fluorescent DCN cell retrogradely tracked from the eyelid with PRV-152. (Scale bar: 20 µm.) (Upper Inset) There are extensive fluorescent neurons in DCN area. (Magnification: 4×.) (Scale bar: 200 µm.) (Lower Inset) A biocytin-filled DCN neuron that was detected with the avidin-biotin complex method. (Scale bar: 50 µm.) (B–D) Typical recordings at a resting membrane potential of −47.6 mV (B), responding to 200-ms depolarizing current steps (C), and a 200-ms hyperpolarizing current step of −0.5 nA (D).

