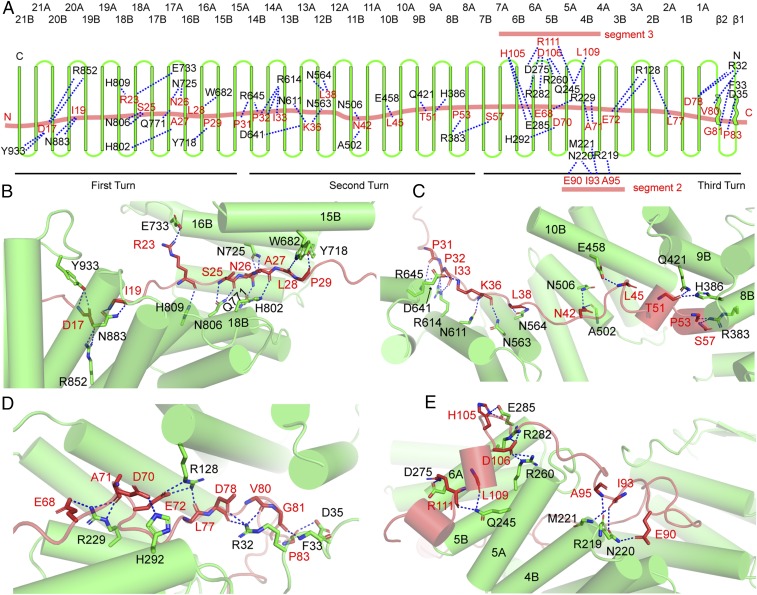
Fig. 3.
Detailed interactions between Ctr9 and Paf1 in the mtPAF1 complex. (A) A diagrammatic view of the interactions between Ctr9 and Paf1. (B) Detailed interactions between the first turn of Ctr9 and Paf1. (C) Detailed interactions between the second turn of Ctr9 and Paf1. (D) Interactions between the third turn of Ctr9 and Paf1. (E) Detailed interactions between segments 2 and 3 of Paf1 and Ctr9.

