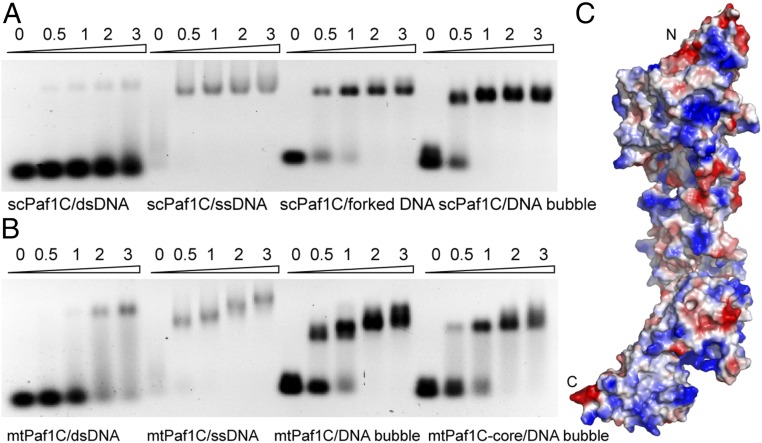
Fig. 5.
The Paf1 complex prefers to bind single-strand–containing DNAs. (A) EMSA analysis of the full-length scPaf1 complex with various DNAs. dsDNA, double-stranded DNA; Paf1C, Paf1 complex; ssDNA, single-stranded DNA. One hundred picomoles of ssDNA or 20 picomoles of all of the other forms of DNAs were used as input. Protein-to-DNA molar ratios are listed above gel lanes. (B) EMSA analysis of the mtPaf1 complex with various DNAs. mtPaf1C-core represents the crystallized ternary complex of the mtPaf1 complex. DNA concentrations are the same as above. Protein-to-DNA molar ratios are listed above gel lanes. (C) Surface electrostatic representation of the structure of the mtPaf1 core complex solved in this study. Positively charged regions are colored in blue. Negatively charged regions are colored in red. Neutral regions are colored in white.

