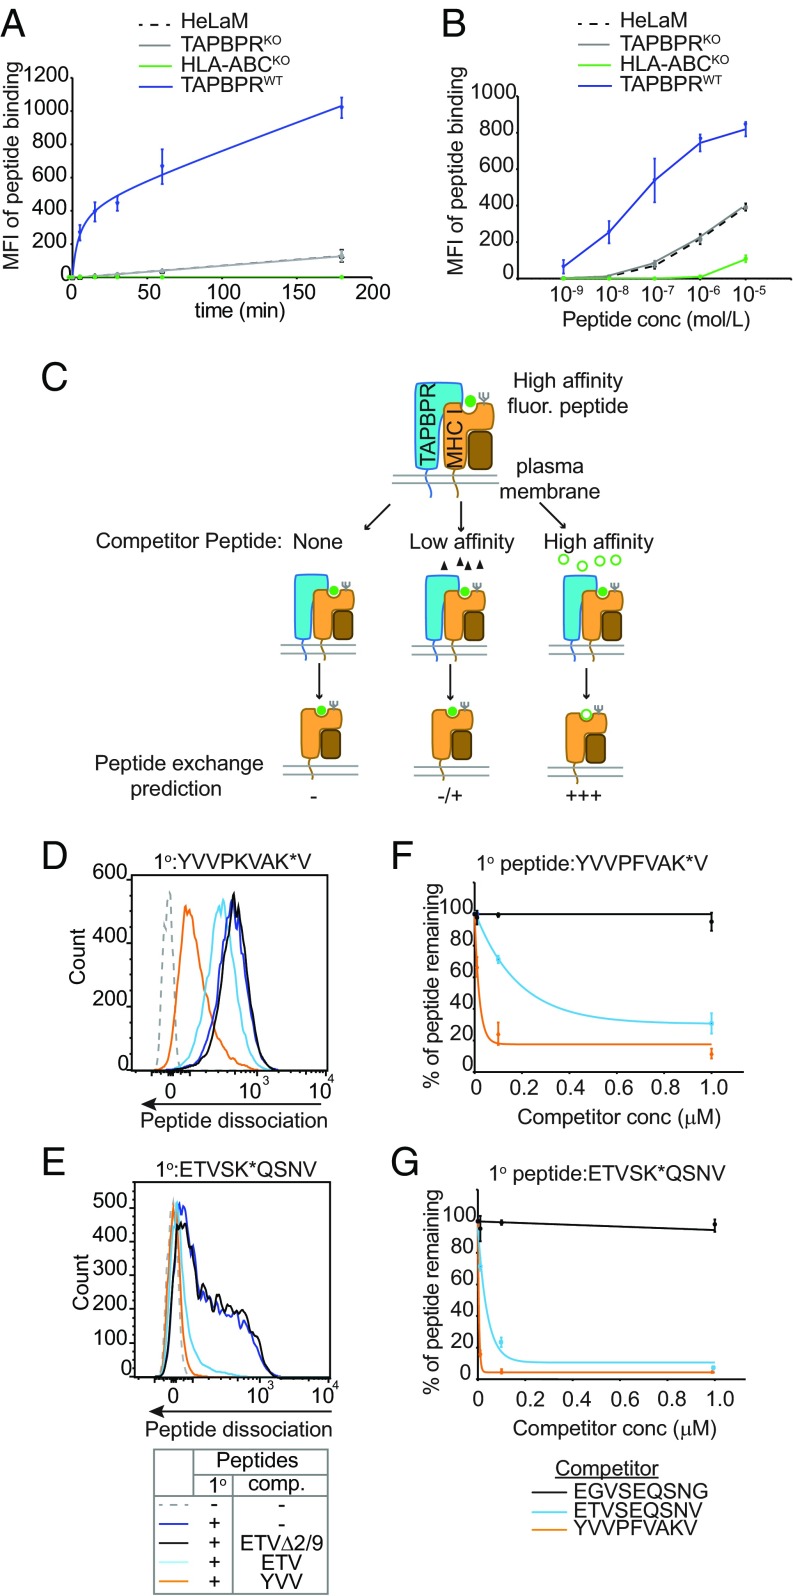
Fig. 2.
Surface TAPBPR functions as a MHC I peptide exchange catalyst. (A) Time course and (B) dose–response curves showing the level of exogenous ETVSK*QSNV binding to IFN-γ–treated HeLaM, HeLaM-TAPBPRKO ± TAPBPRWT, and to HeLaM-HLA-ABCKO cells treated with (A) 10 nM ETVSK*QSNV from 0 to 180 min at 37 °C or (B) increasing concentration of ETVSK*QSNV for 15 min. Line graphs show MFI ± SD from three independent experiments. Histograms displaying the typical fluorescent peptide binding observed on HeLaMKO-TAPBPRWT–expressing cells for both the time course and dose–response experiment are provided in SI Appendix, Fig. S2 C and D, respectively. Note: in B ETVSK*QSNV binding using 1 nM–1 µM peptide was dependent on MHC I, given that no exogenous peptide association was observed on HeLaM-HLA-ABCKO cells at these concentrations. (C) Schematic representation of experimental workflow used to measure peptide exchange by PM-bound TAPBPR. (D–G) IFN-γ–treated HeLaKOTAPBPRWT cells were incubated with 10 nM (D and F) YVVPKVAK*V or (E and G) ETVSK*QSNV for 15 min at 37 °C, then washed to remove unbound peptide. Dissociation of the fluorescent peptides was subsequently monitored in the absence or presence of increasing concentrations of the unlabeled competitor peptides YVVPFVAKV (YVV), ETVSEQSNV (ETV), or EGVSEQSNG (ETVΔ2/9) for 15 min at 37 °C. (D and E) Histograms show the typical dissociation of fluorescent peptide observed following incubation with 100-nM competitor peptide. (F and G) Line graphs show the percentage of fluorescent peptide remaining ±SD following treatment with increasing concentrations of unlabeled peptide from (F) four and (G) three independent experiments.

