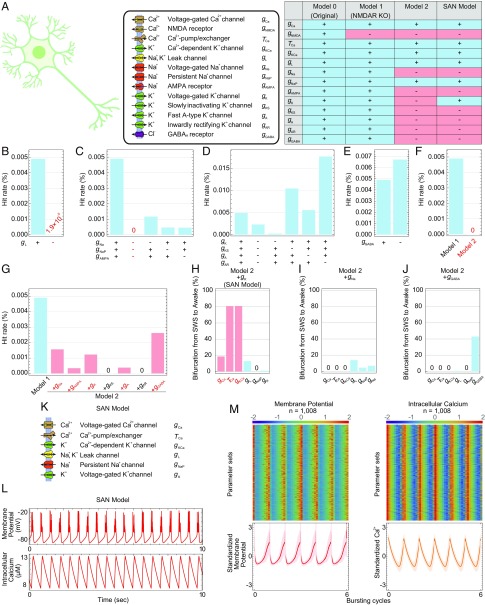
Fig. 1.
Construction of the SAN model by simplifying the AN model. (A) Schematic illustration of the AN model (Left). Table shows the channels included in each model (Right). (B–E) Hit rates of model 1 or model 1 under the KO of leak channels (B), Na+ channels (C), K+ channels (D), or GABA receptors (E). (F and G) Hit rates of model 1 or model 2 (F) or model 1 or model 2 plus each ion channel condition (G). (H–J) Summary of the bifurcation analysis in each condition: model 2 plus gK (H), model 2 plus gNa (I), or model 2 plus gGABA model (J). Conductance and time constants related to the Ca2+-dependent hyperpolarization pathway are in red. (K) Schematic illustration of the SAN model. (L) Typical patterns of the membrane potential and intracellular Ca2+ concentration in the SAN model. (M) The standardized membrane potential and intercellular Ca2+ concentration of the 1,008 parameter sets obtained by parameter searches in the SAN model. The line and shadow (Lower) indicate the mean and SD, respectively.

