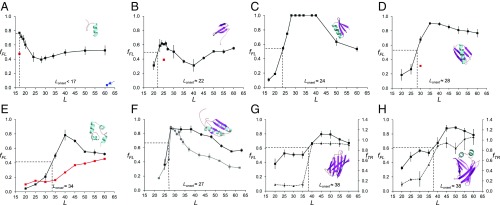
Fig. 2.
Fraction full-length protein (fFL) and thermolysin-resistant protein (fTR) plotted as function of L for the eight proteins discussed in the text. Each data point is an average of three independent experiments (error bars indicate SEM values). Lonset is the L value corresponding to half-maximal peak height (indicated by dotted lines), and Lmax is the L value corresponding to the maximum of the peak. (A) FSD1. The red data point at L = 17 residues is for the destabilizing mutation F21P. The blue data point at L = 61 residues (arrow) is for a construct where the (GS)n linker was replaced by a linker derived from the LepB protein (Materials and Methods). (B) WW domain. The red data point at L = 25 residues is for the destabilizing mutation Y19A. (C) Designed protein EHEE_rd2_0005. (D) Protein G, the red data point at L = 30 residues is for the destabilizing mutation F52L. (E) Calmodulin EF-2–EF-3. The black profile was obtained in 3 mM CaCl2, and the red profile in 0.3 mM EGTA. (F) Ribosomal protein S6. The black profile was obtained with the SecM(Ec) AP, and the gray profile with the SecM(Ms) AP. (G) SOD1 (lacking the metal-loading loops IV and VII). The full curve (squares) is the fFL profile and the dashed curve (triangles) is the thermolysin-resistance profile (fTR). (H) ILBP. The full curve (squares) is the fFL profile and the dashed curve (triangles) is the thermolysin-resistance profile (fTR).

