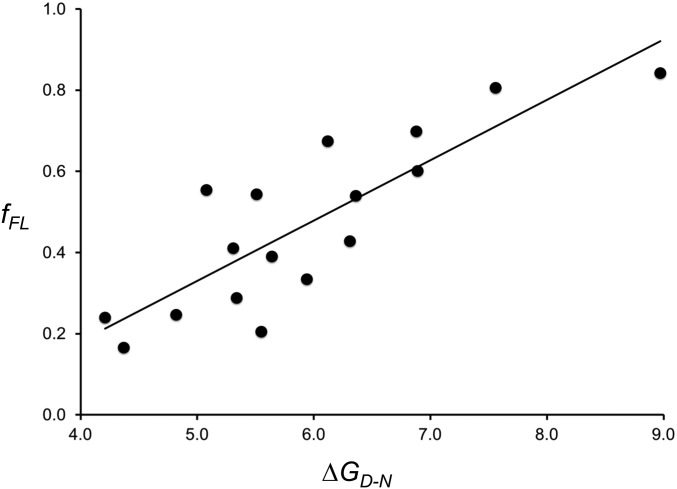
Fig. 3.
Correlation between fFL and ΔGD-N values for wild-type S6 and 16 point mutations listed in SI Appendix, Table S3. The best-fit linear regression line is shown (fFL = 0.15 ΔGD-N − 0.41; R2 = 0.70; P = 2 × 10⁻⁵). Statistical analysis was performed using the StatPlus:mac Pro software.

