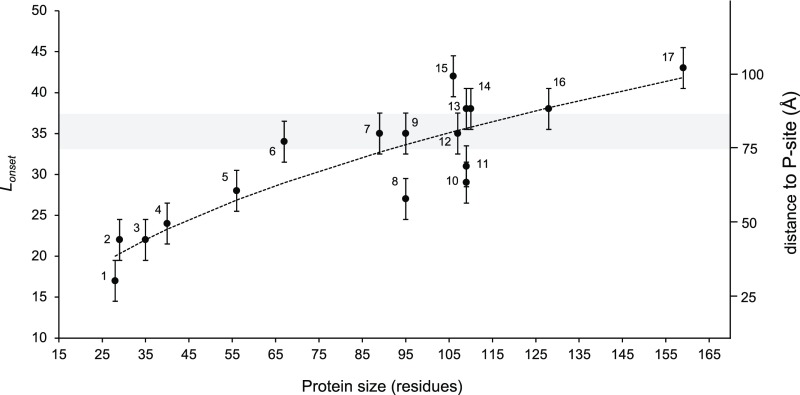
Fig. 5.
Plot of Lonset vs. protein size for proteins included in this and previous studies. The shaded gray area indicates the approximate location of the distal end of the exit tunnel, and numbers on the right indicate the approximate distance from the peptidyl transferase center. Error bars of ±2.5 residues have been added to indicate that the fFL profiles in Fig. 2 were recorded with a five-residue resolution, hence introducing an uncertainty in the Lonset values. The dotted curve shows the linear best-fit obtained from a log-log plot: log10(Lonset) = 0.42 (±0.05) ∙ log10(size) + 0.69 (±0.1) (R2 = 0.80; P = 1.4 × 10⁻⁶). Proteins are indicated as follows: 1, FSD1; 2, ADR1a1; 3, WW domain; 4, EHEE; 5, protein G; 6, calmodulin EF-2–EF-3; 7, titin I27; 8, S6; 9, TOP7; 10, spectrin β16; 11, spectrin R16; 12, PENT; 13, spectrin R15; 14, SOD; 15, FLN5; 16, ILBP; and 17, DHFR (see SI Appendix, Table S5 for references).

