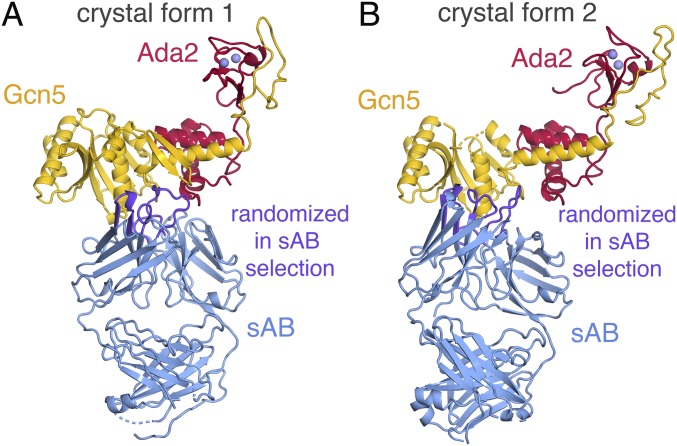
Fig. 2.
Ada2/Gcn5 crystal forms 1 and 2 structures. (A) Crystal form 1 with Ada2, Gcn5, the sAB, and zinc ions shown in red, yellow, blue, and lavender, respectively. The sAB regions randomized in the selection process are shown in purple. Internal disordered regions of 10 residues or less are shown in dashes. (B) Crystal form 2 with the same coloring conventions as for A.

