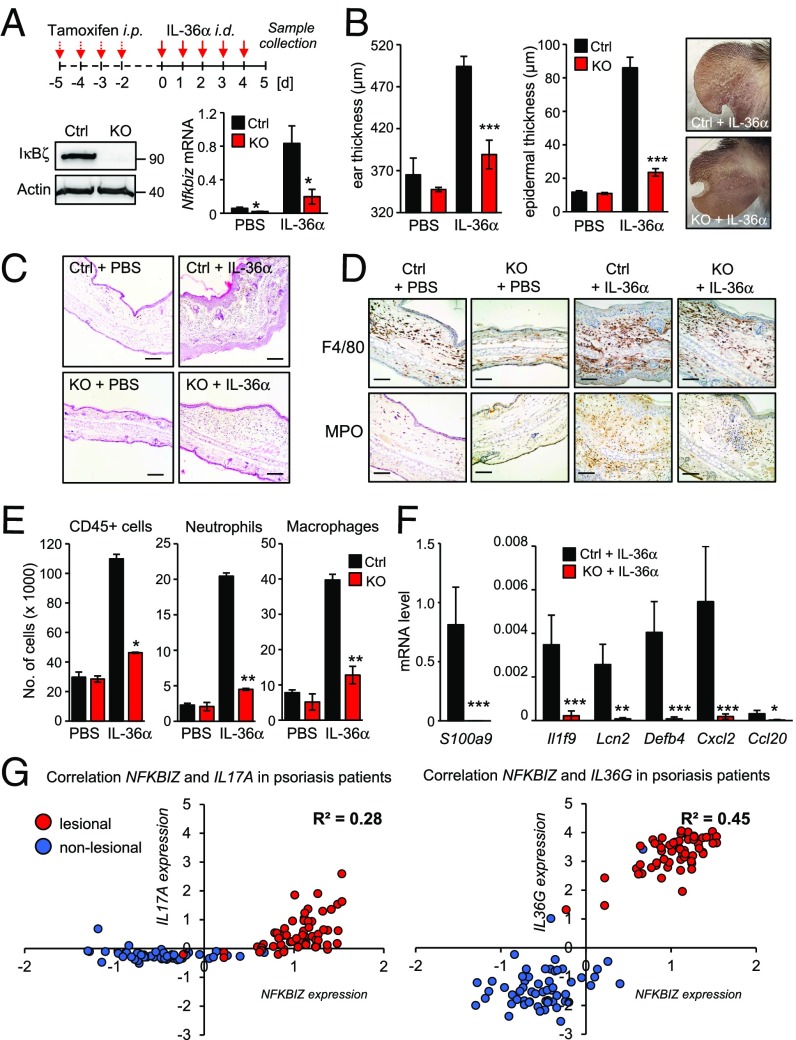
Fig. 4.
Characterization of the IL-36/IκBζ axis in vivo. (A, Upper) Scheme of tamoxifen and IL-36α treatment of control and inducible Nfkbiz-KO mice. (Lower) Verification of Nfkbiz deletion at the protein and mRNA level. For induction of IκBζ KO, Nfkbiz flox/flox (Ctrl) and Rosa-creERT2 Nfkbiz flox/flox (KO) mice received i.p. injections of tamoxifen (75 mg/kg) for four consecutive days to induce activation of Cre recombinase. Afterward, 1 µg murine IL-36α or PBS control was intradermally injected into one ear of the mice for five consecutive days. (B) Ear and epidermal thickness (± SEM) of PBS- and IL-36α–treated mice at day 5 from two (for PBS) or six (for IL-36α) animals per group. Pictures were taken at day 5 to show scaling at the treatment area. (C) H&E staining of ears from PBS- and IL-36α–treated control and KO mice. (Scale bars: 140 µM.) (D) Immunohistochemistry for the macrophage marker F4/80 and the neutrophil marker MPO. (Scale bars: 80 µM) (E) Characterization of CD45+ immune cell infiltrates by flow cytometry. Neutrophils were characterized as CD45+ Ly6G+ and macrophages as CD45+, CD11bhi and F4/80+. Error bars indicate results from two independent experiments. (F) Psoriasis-related gene expression in ears from IL-36α–treated mice. Results are shown as means ± SEM; n = 6 animals per group. (G) Expression data from skin biopsies of 64 healthy individuals and 58 psoriasis patients were analyzed from the Gene Expression Omnibus profile dataset GDS4602. Shown are normalized expression values of NFKBIZ and IL17A or NFKBIZ and IL36G, which were plotted against each other in every single nonlesional and lesional biopsy. Depicted is the regression coefficient (R2) from the expression values of the psoriatic skin biopsies. *P < 0.05; **P < 0.01; ***P < 0.001.

