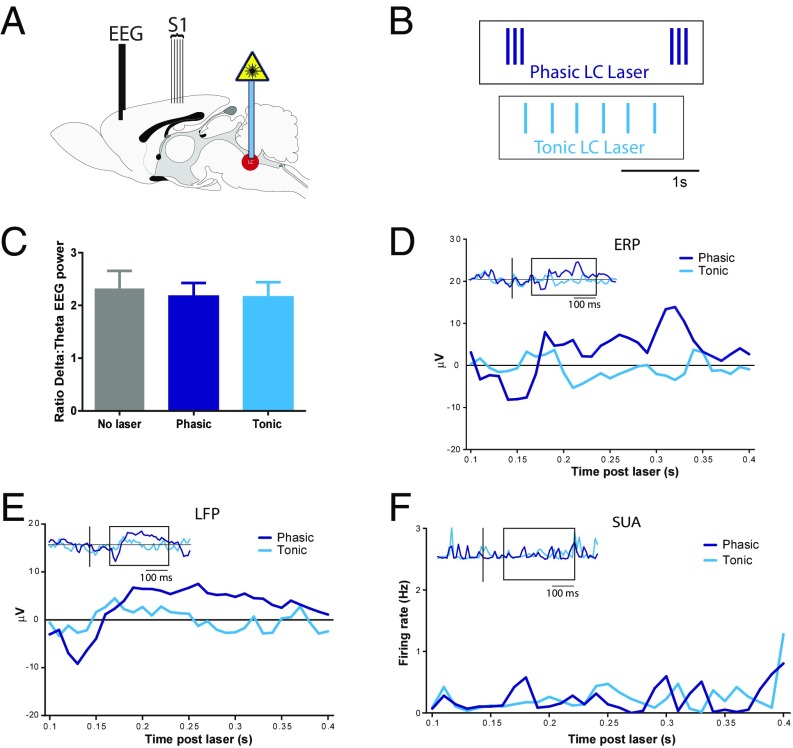
Fig. 2.
Phasic LC drives responses across cortical target regions. (A) Schematic showing location of prefrontal EEG electrodes for recording ERPs and S1 electrodes for recording LFPs during blocks of tonic or phasic optogenetic LC stimulation. (B) Excerpts of laser pulse trains used for LC photoactivation: tonic (3-Hz continuous, cyan blue) or phasic (three-pulse 12 Hz every 0.5 Hz, dark blue). (Scale bar: 1 s.) (C) Graph showing no change in δ dominance of EEG recording over 100 s for either phasic or tonic LC photoactivation. (D) Average PFC ERP signal across 100 s of continuous LC photoactivation (n = 16 recordings, n = 6 animals, 50 trials, 2 s per trial) from 100 to 400 ms after laser pulse onset (expansion of boxed region in Inset). (Inset) Extended cortical ERP at −0.2 s through +0.5 s post-LC stimulation with line at laser onset. Phasic-LC ERPs (dark blue lines) show both N100-like (130-ms latency) and P300-like (330-ms latency) components. (E) Averaged LFP signal from S1 cortex from 100 to 400 ms after laser pulse onset during 100 s of continuous LC photoactivation showing N100-like and P300-like responses after phasic (dark blue lines) LC bursting (n = 18 recordings, n = 7 animals) (Inset, extended LFP at −0.2 s through +0.5 s post-LC stimulation with line at laser onset). (F) Neither tonic (cyan blue) nor phasic (dark blue) LC activation alone caused temporally specific changes in S1 single-unit activity (SUA; n = 135 units, 18 recordings from seven animals) (Inset) S1 SUA at −0.2 through +0.5 s with line at laser onset.

