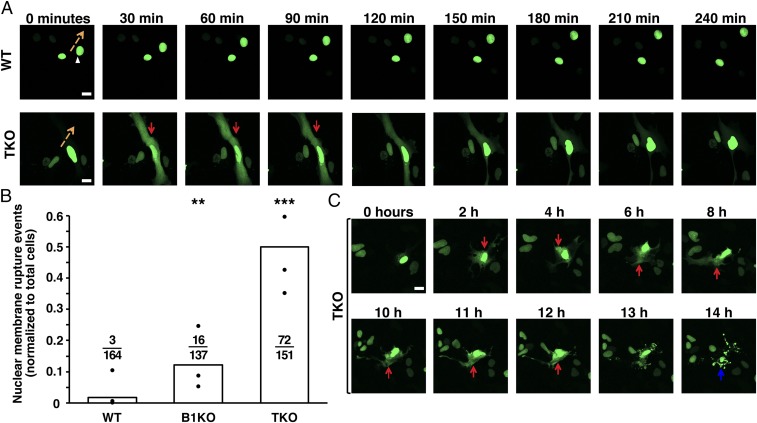
Fig. 3.
Nuclear membrane ruptures in TKO MEFs. (A) Sequential images of WT and TKO MEFs expressing a green fluorescent protein fused to a nuclear localization signal (NLS-GFP) (green) and imaged by live-cell fluorescence microscopy for 240 min. Images at 30-min intervals are shown. The orange arrows indicate the direction of nuclear movement, and the red arrows point to a nuclear membrane rupture event in a TKO MEF. (B) Bar graph showing the number of nuclear membrane ruptures as a percentage of the total number of cells evaluated. The black circles show the averages for three independent experiments. Ratios above each genotype show the total number of nuclear membrane rupture events divided by the total number of cells evaluated. Nuclear membrane ruptures were more frequent in TKO and B1KO MEFs than in WT MEFs. **P < 0.001; ***P < 0.0001 by χ2 test. (C) Sequential images showing a nonhealing nuclear membrane rupture in a TKO MEF (NLS-GFP remains in the cytoplasm) and cell death after 14 h. (Scale bars: A and C, 20 μm.)

