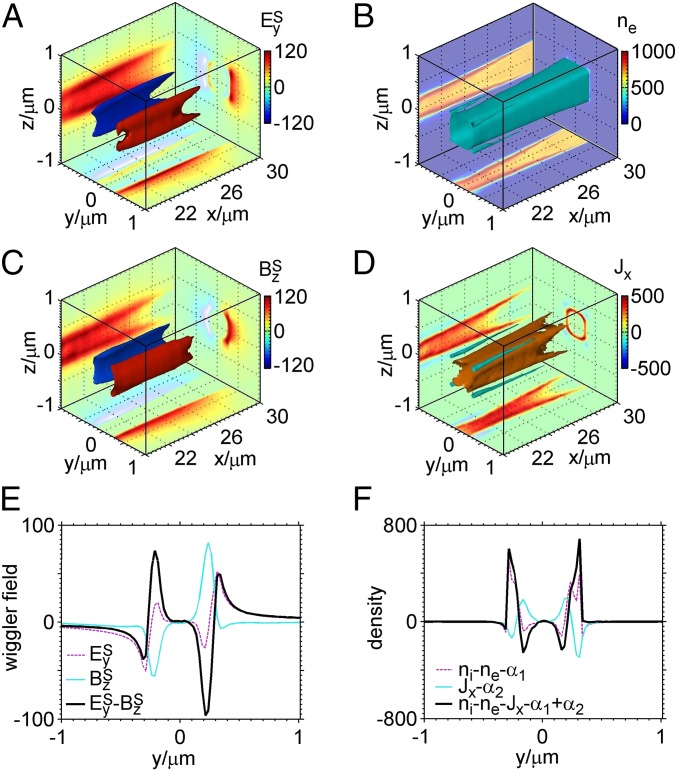
Fig. 3.
Wiggling fields. 3D isosurfaces of (A) electrostatic and (C) magnetostatic fields (), (B) electron density (), and (D) current density () at the time of 30 as well as the slices at the planes with respective peak values, where they are obtained by temporally averaging , , , and , respectively, over one laser cycle. The corresponding one-dimensional distributions of these fields and densities at and are shown in E and F.

