Fig. 7.
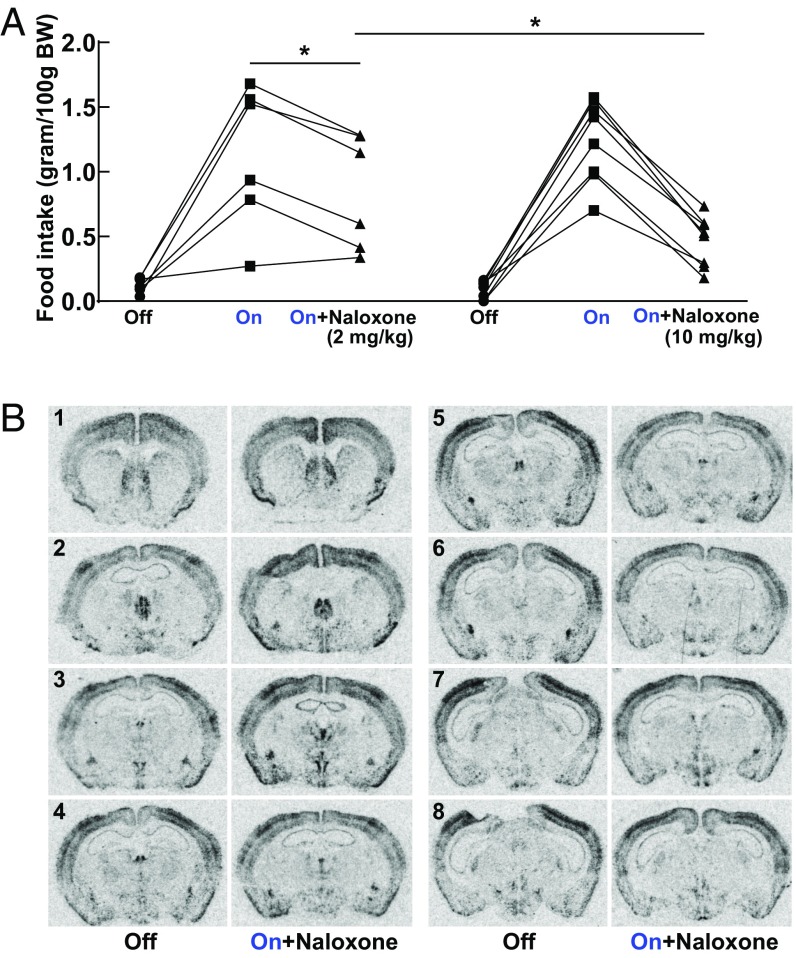
Involvement of endogenous opioids in the increased feeding of Tg POMC-ChR2 mice. (A) Increased food intake in Tg POMC-ChR2 was reduced by pretreatment with naloxone in a dose-dependent manner (n = 6 mice in 2 mg/kg naloxone group; n = 8 mice in 10 mg/kg naloxone group). A multilevel regression model was used to assess the effects of light stimulation, naloxone treatment, and naloxone dosage on food intake, as well as a conditional effect of dosage on naloxone treatment (naloxone × dosage). Light stimulation increased food intake, β = 1.08, T(25) = 12.26, P < 0.0001, in a manner that was opposed by naloxone treatment at 2 mg/kg, β = −0.33, T(25) = −2.61, *P < 0.05. The ability of naloxone to oppose the effects of the light stimulation was even stronger in the group of mice treated with a higher dosage of naloxone, β = −0.42, T(25) = −2.71, *P < 0.05; 10 mg/kg versus 2 mg/kg. Otherwise food intake in these two groups of mice was similar, β = 0.04, T(12) = 0.27, P = 0.79. Mean ± SEM, 2 mg/kg naloxone group: 0.13 ± 0.02 (light off, saline); 1.13 ± 0.23 (light on, saline); 0.84 ± 0.18 (light on, naloxone); 10 mg/kg naloxone group: 0.092 ± 0.024 (light off, saline); 1.24 ± 0.11 (light on, saline); 0.46 ± 0.069 (light on, naloxone). (B) ISH revealed that cFos mRNA expression was either normalized or reduced in brain regions involved in reward and motivation by pretreatment with opioid antagonist naloxone (10 mg/kg). Images were quantified with results shown in SI Appendix, Table S4. Representative images are shown ranging from Bregma 1.10 mm (indicated by the no. 1) through Bregma −2.12 mm (indicated by the no. 8).

