Fig. 1.
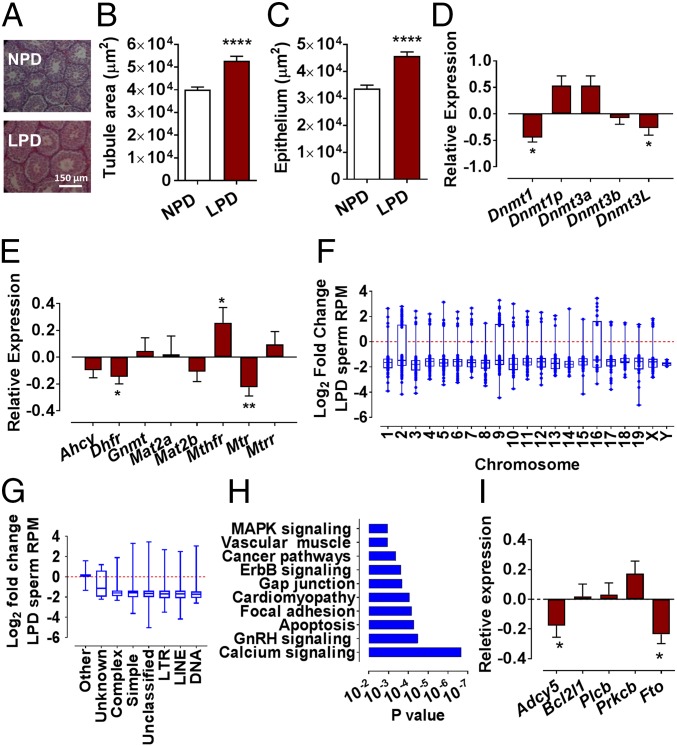
Paternal LPD impacts on testicular morphology and epigenetic status. Representative histological images of NPD and LPD testes (A) with area of seminiferous tubules (B) and epithelium (C). Relative NPD and LPD testicular transcript expression of DNA methyltransferases (D) and folate-cycle enzymes (E). LPD sperm methylation status relative to NPD sperm (Log2 fold differences of reads per million, RPM) (F). DNA-repetitive elements’ distribution of differentially methylated loci (G). Pathway analysis of differentially methylated loci between NPD and LPD sperm (H). Relative NPD and LPD sperm transcript expression of differentially methylated genes (I). n = 8 males per dietary group. n = 2 pools of NPD and LPD sperm for F-I. Transcript expression in NPD tissues normalized to 0. Data are mean ± SEM for (B, E, and I). Data are mean ± SEM. *P < 0.05, **P < 0.01, ****P < 0.0001.

