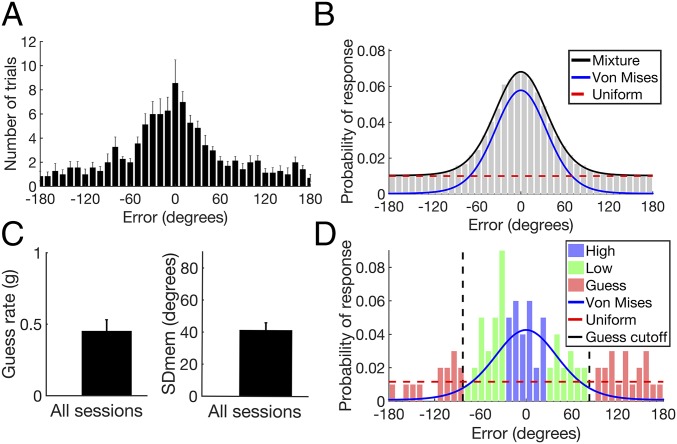
Fig. 2.
Mixture model and performance. (A) Histogram of errors across all sessions. (B) Example of a mixture model fit to simulated data. (C) Mean guess rate and SDmem across all sessions. (D) Example of a mixture model fit to the data from subject 1. The cutoff for trials placed in the guess condition (±83; black dashed line) was derived from the cumulative distribution function of the von Mises distribution, i.e., 90% of trials that were remembered with some degree of precision fell within ±83 (see text). Error bars indicate SEM.

