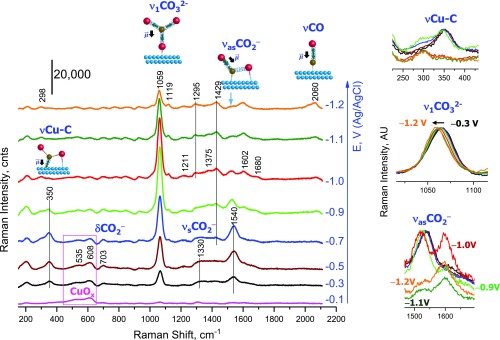
Fig. 2.
Operando SERS of rough Cu surface in CO2-saturated in 0.1 M NaHCO3 (pH 6.8). Spectra were measured from −0.1 V toward the cathodic direction. Panels on the Right show the enlarged and scaled by intensity peaks of adsorbed *CO32− and *CO2−. The enlarged peak of *CO is shown in SI Appendix, Fig. S10. The color code in the Right panels is the same as in the main figure. The intensity of the spectrum measured at −1.2 V is underestimated because the SERS signal dropped due to HER. For the sake of simplicity, we label the vibrations of adsorbed ligands as the parent vibrations of the corresponding free ligands.

