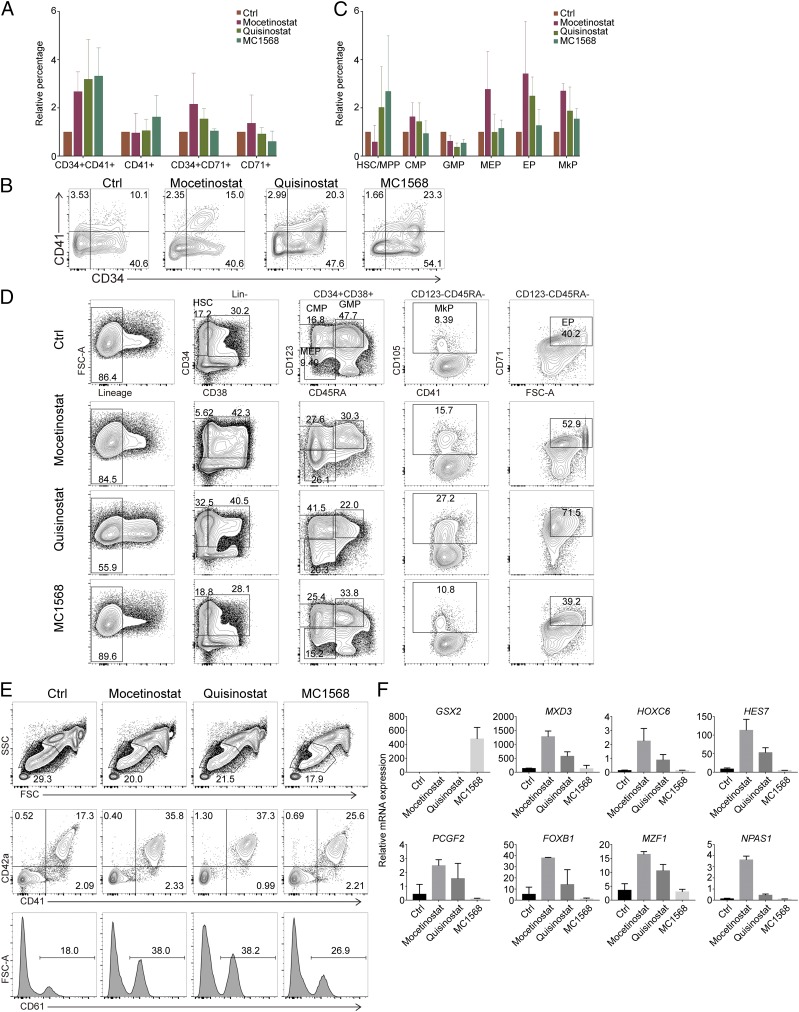
Fig. 4.
HDAC inhibitors promote MkP differentiation. (A and B) Summary (A) or flow cytometry plot (B) for the increase/decrease of MkP (CD34+CD41+)- or EP (CD34+CD71+)-enriched population after different HDAC inhibitor treatment in CD34+ HSPC culture. Here, the percentage of the control cell-derived MkP- and EP-enriched populations is set to 1, and percentage from other treatments was normalized to that. n = 3; error bar indicates SD. (C and D) Summary (C) or flow cytometry plot (D) for the increase/decrease of different HSPC populations after different HDAC inhibitor treatment in CD34+ HSPC culture. Here, the percentage of the control cell-derived HSPC populations is set to 1, and percentage from other treatments was normalized to that. n = 3; error bar indicates SD. (E) FACS analysis of platelet surface markers CD41, CD42a, and CD61 after HDAC inhibitor treatment. (F) Expression analysis of some of the hit TF changes in HDAC inhibitor-treated cells by real-time PCR. n = 3; error bar indicates SD.

