Fig. 4.
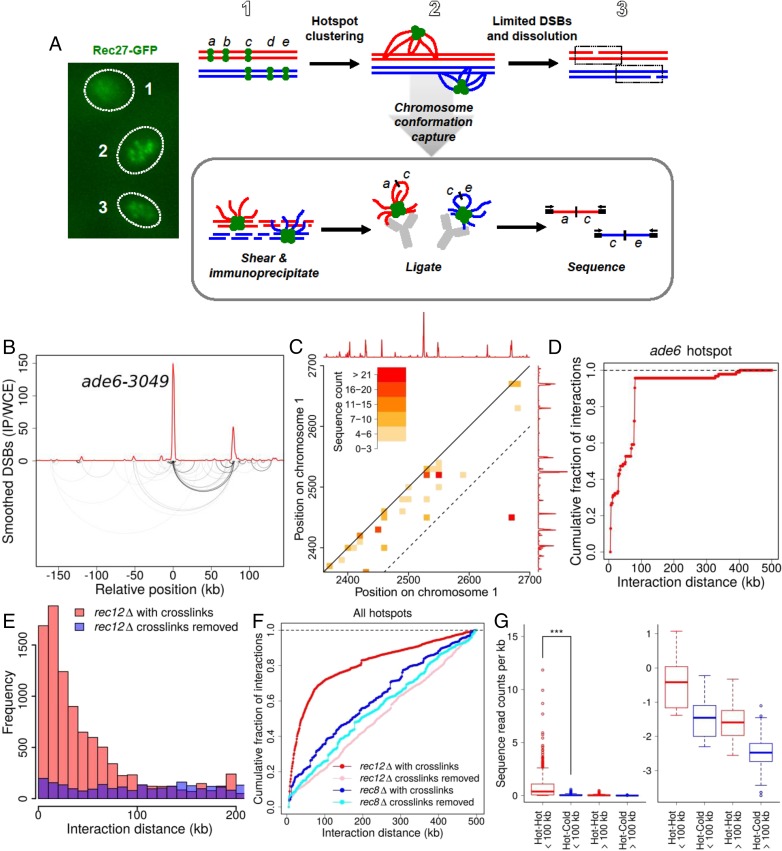
Physical clustering of DSB hotspots is limited to an ∼200-kb chromosomal region. (A) Scheme for determining clustering of DSB hotspots bound by LinE proteins, such as Rec27-GFP, which form a limited number of foci (or clusters of foci) in meiotic nuclei (Left) (31), perhaps corresponding to the steps in the Upper row. DNA within each cluster is cross-linked to a tagged LinE protein and analyzed as indicated in the box (see text). (B) Analysis of DNA bound by Rec27-GFP, which binds DSB hotspots with high specificity (4), shows preferential ligation of the ade6-3049 hotspot DNA to another hotspot ∼80 kb away (lower arcs; darker lines indicate greater frequency). Ligated sequences were omitted if neither end mapped to a hotspot. The red line indicates DSB frequency relative to genome median, determined by microarray hybridization (4). See also SI Appendix, Fig. S7. (C) Standard contact heat-map of ligations (hot–hot and hot–cold) in the 2,350–2,700 kb region of Chr 1. DSB frequency relative to the genome median (red line, on a linear scale) is from ref. 12. The dashed line indicates positions 100 kb apart on the chromosome; note that most of the intense interactions are within this limit, with the exception of ligations between two hotspots about 250 kb apart. See also SI Appendix, Figs. S8–S10. (D) Summation of all ligations between the ade6-3049 hotspot and DNA within 500 kb of each side. (E) Distance between pairs of sites ligated among all genomic hotspots with chromatin cross-links maintained until after ligation (red bars) or with cross-links removed just before ligation (purple bars; blue where these values are greater than those with maintained cross-links). (F) Summation of ligations between all genomic hotspots with chromatin cross-links maintained until after ligation (red line) or with cross-links removed just before ligation (pink line). Preferential ligations between nearby hotspots are much less frequent and extend greater distances in the absence of the Rec8 cohesin subunit with (dark blue line) or without (light blue line) maintenance of chromatin cross-links (see also SI Appendix, Fig. S13). (G, Left) Ligations between hotspots <100 kb apart are more frequent than those >100 kb apart (***P < 0.001 by unpaired t test). (Right) The same data are shown on a log10 scale for clarity of low levels. Data are the number of ligations per kilobase; mean values (thick horizontal bars) are flanked by the 25th and 75th percentiles (boxes) and 95th percentiles (whiskers). See SI Appendix, Fig. S6D for additional data with Rec25 and with another tag for immunoprecipitation and SI Appendix, Figs. S6–S13 for additional data.

