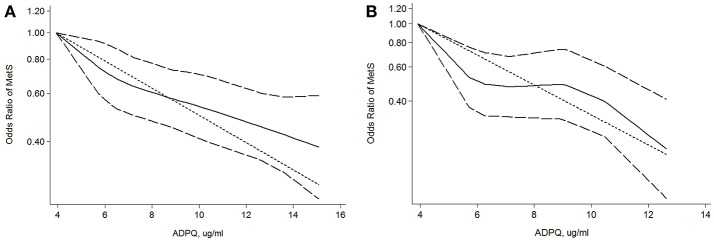
Figure 5.
Dose-response relationship between circulating adiponectin levels and metabolic syndrome risk. (A) Evaluation of association between circulating ADPQ and MetS risk in all cohorts based on restricted cubic splines and generalized least squares dose-response models; (B) Evaluation of association between circulating ADPQ and MetS risk in male cohorts based on restricted cubic splines and generalized least squares dose-response models. The solid and long-dashed curves represent instant estimates of the OR and its 95% CI for MetS risk based on the subgroup with the lowest average ADPQ level based on the restricted cubic splines model. The short-dashed line represents the estimates of the OR for MetS risk based on the subgroup with lowest average ADPQ level using the generalized least squares model. ADPQ, adiponectin; CI, confidence interval; MetS, metabolic syndrome; OR, odds ratio.

