FIGURE 4.

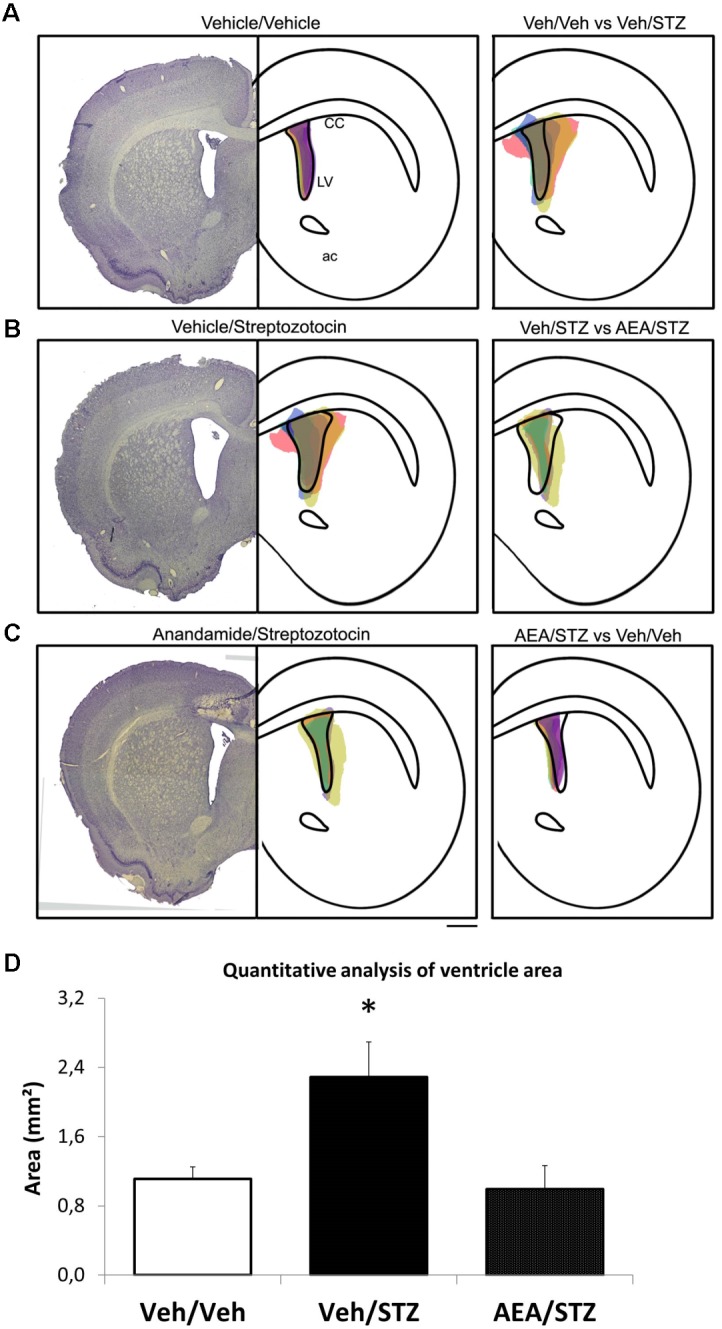
Schematic representation and quantitative analysis of the cerebral ventricular area of Veh/Veh, Veh/STZ, and AEA/STZ animals. The left panel presents a representative histologic image of the lateral ventricle (LV) of the Veh/Veh groups in (A), Veh/STZ in (B), and AEA/STZ in (C). The central panel represents schematically the shape of the histological figure from left, filled with colored spots corresponding to the ventricular area of each of the samples used in the respective groups (n = 3–5). The right panel represents the central figure with the shape of the ventricle of one group overlapped with the ventricular area of the samples from another group (A: Veh/Veh × Veh/STZ, B: Veh/STZ × AEA/STZ and C: AEA/STZ × Veh/Veh). (D) shows the quantitative analysis of ventricle area (mm2), measured + 1.56 mm (anteroposterior) from bregma. ∗p < 0.05, area values are different from Veh/Veh and AEA/STZ (one-way ANOVA, followed by Duncan’s post-test).
