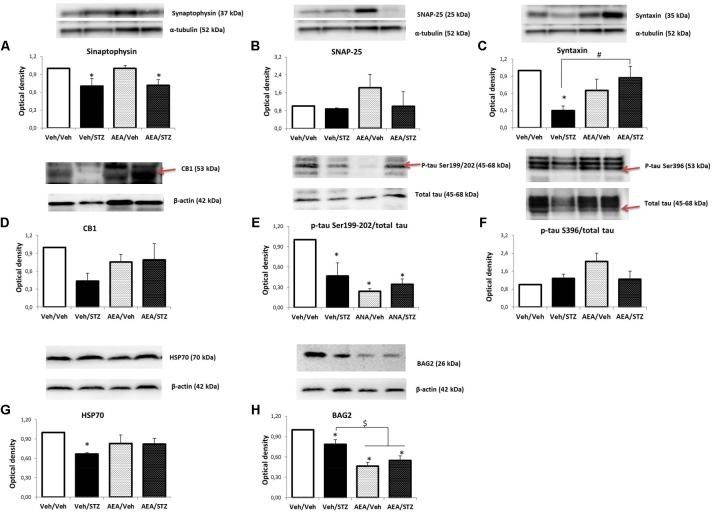
FIGURE 5.
Levels of synaptophysin (A), SNAP-25 (B), syntaxin (C), CB1 receptor (D), p-tau Ser199/202/total tau (E), p-tau Ser396/total tau (F), HSP70 (G), and BAG2 (H) in the hippocampus of Wistar rats icv-treated with AEA and/or STZ (Veh/Veh, Veh/STZ, AEA/Veh, and AEA/STZ), quantified by Western blotting. Synaptophysin, SNAP-25 and syntaxin levels were normalized by α-tubulin levels. CB1 receptor, HSP70 and BAG2 levels were normalized by β-actin levels. P-tau Ser199/202 and Ser396 levels were normalized by total tau levels. Data are represented as means ± S.E.M of the percentage of groups treated with AEA and/or STZ compared to Veh/Veh, which was considered 1.0 (n = 3-5 animals per group), ∗p ≤ 0.05, optical density values are different from Veh/Veh, #p ≤ 0.05, optical density values of AEA/STZ are different from Veh/STZ, $p ≤ 0.05, optical density values of AEA/Veh and AEA/STZ are different than Veh/Veh and Veh/STZ (one-way ANOVA, followed by Duncan’s post-test). Red narrows indicate the bands that were analyzed.

