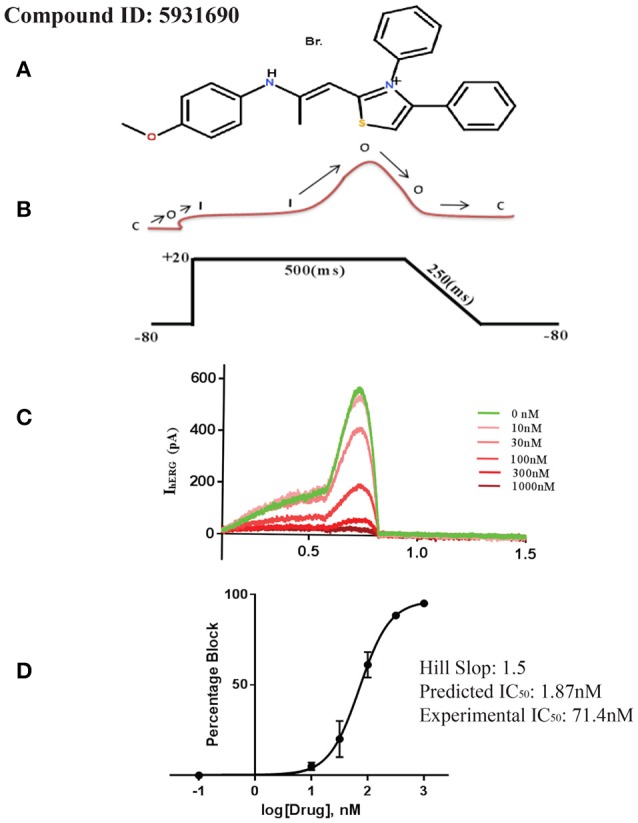
Figure 10.

(A) 2D structure of selected compound from ChemBridge database. (B) Step ramp protocol. (C) Plot of current (pA) traces vs. time(s): Green sweep is showing maximum current passing through the channel when no drug is applied to the channel. The gradual decrease in current peak is showing channel inhibition in response to various dose concentrations. (D) Dose-response curve showing percentage blockade of hERG current against various drug concentration.
