Figure 5.

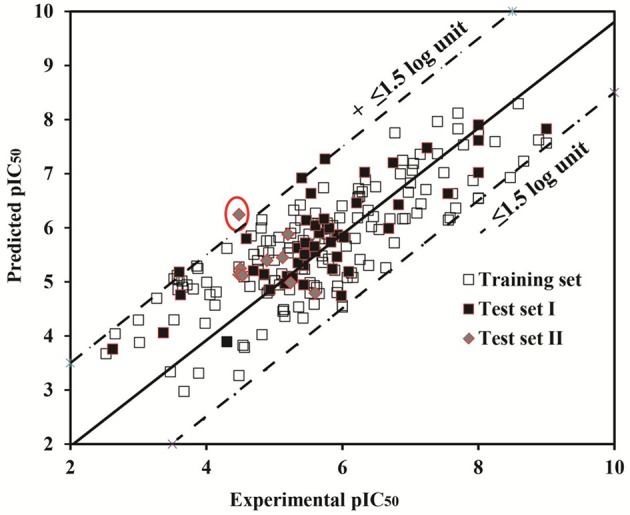
The plot of observed vs. predicted pIC50 values of the test set I (filled square), test set II (filled diamonds) projected on observed vs. predicted pIC50 values of the training set (hollow square).

The plot of observed vs. predicted pIC50 values of the test set I (filled square), test set II (filled diamonds) projected on observed vs. predicted pIC50 values of the training set (hollow square).